
Percentage Spider Chart
Loading the math board and drawing, please wait…
In collections
Lesson Starters
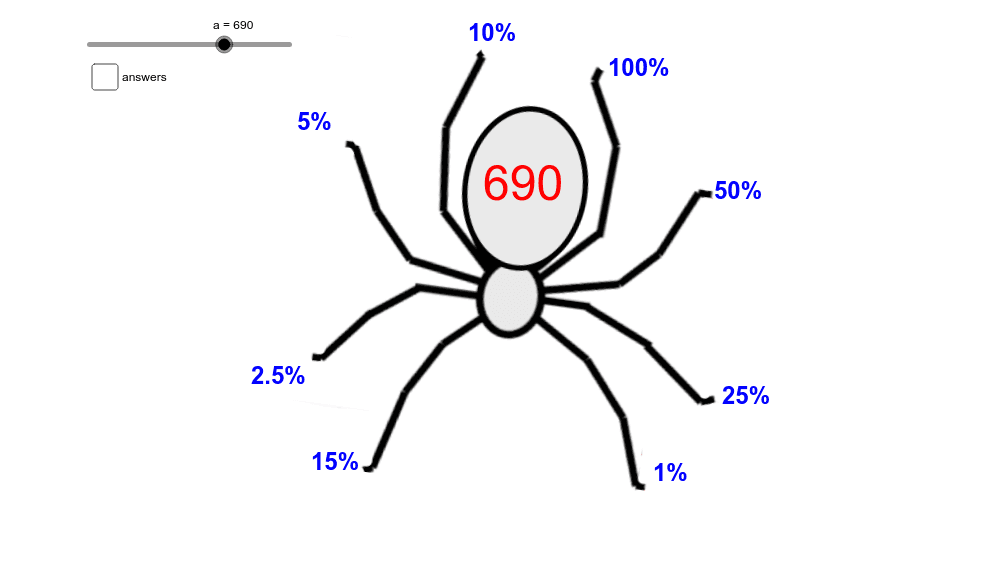
This example demonstrates how to create a percentage spider chart using GeoGebra. It involves statistical data representation and proportion relationships. By using points, text, and image objects, users can easily create and adjust the spider chart. Suitable for middle school and above students and teachers for teaching and learning data visualization.
GeoGebra Commands & Parameters
Point A(-10.42, -8.48)Point B(-0.8, -9.8)Numeric a(630.0)Point C_1(8.04, 1.58)Point D_1(8.02, 0.48)Point C(1.38, -3.76)Point D(10.8, -5.06)(0.01 * a)(0.25 * a)(0.5 * a)a(0.1 * a)(0.05 * a)(0.025 * a)(0.15 * a)Boolean b(false)