
Pearson's MCC: Regression and Correlation
Loading the math board and drawing, please wait…
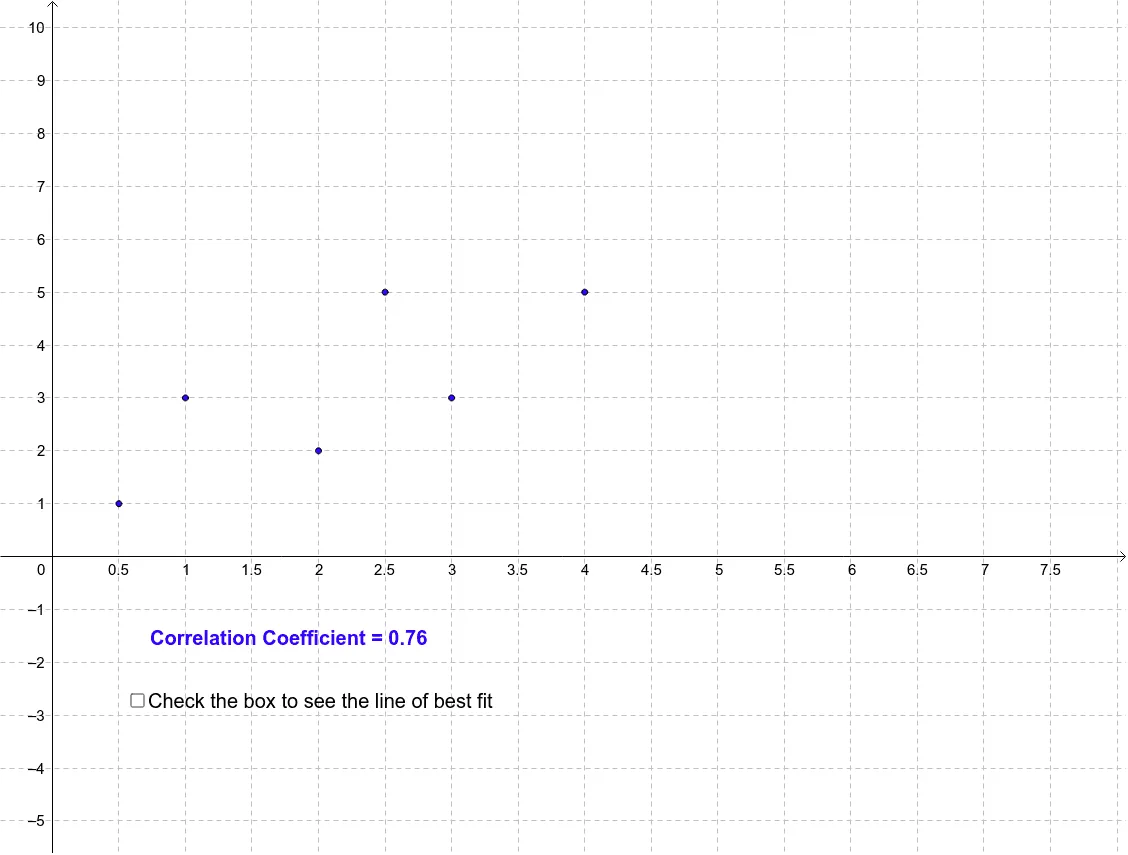
This interactive GeoGebra example demonstrates how the Pearson product-moment correlation coefficient (PMCC) responds to changes in a scatter plot. By dragging data points, users can see the correlation coefficient r update in real time, revealing how the strength and direction of a linear relationship are reflected in the visual clustering of points. The core mathematical concepts include Pearson correlation, linear regression (least-squares fit), scatter plots, and measures of association. The construction uses GeoGebra commands PMCC to compute the correlation coefficient and FitLineY to generate the regression line. Key objects include data points A, B, C, D, E, F, a list list1, a text text1 displaying the r value, and parameters a and b representing the slope and intercept of the fitted line. This resource is ideal for high school or introductory college statistics courses, helping students grasp the geometric meaning of correlation and regression through hands-on exploration, and is also useful for classroom demonstrations or self-study.
GeoGebra Commands & Parameters
PMCC(list1) → rFitLineY(list1) → a
AI Drawing Prompt Reference
Create a scatter plot with 6 data points A, B, C, D, E, and F. As you move these points, observe how the scatter plot changes and see the Pearson correlation coefficient r update in real time, along with the best-fit line.
The prompt above was compiled from the original drawing commands and is for reference only.