
Pearson Correlation Coefficient Demo
Loading the math board and drawing, please wait…
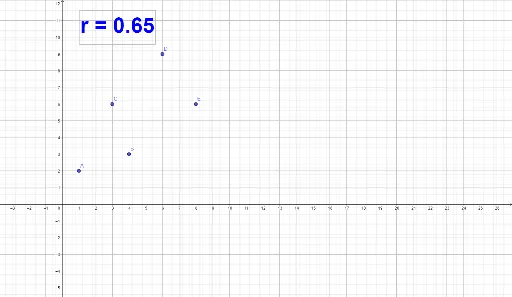
This GeoGebra example demonstrates how to calculate and visualize the Pearson product-moment correlation coefficient (PMCC) between two datasets. Core mathematical concepts include: the definition of correlation coefficient, its range (-1 to 1), and statistical interpretation—positive correlation, negative correlation, and no correlation. Construction details: use scatter plots (points A, B, C, D, E, etc.) to display raw data distribution, apply linear regression or ellipse fitting to intuitively show correlation strength, and display the specific correlation value using text objects. Suitable for high school or introductory college students learning statistical correlation analysis, and can serve as an entry-level case for data visualization teaching.
GeoGebra Commands & Parameters
PMCC({A, B, C, D, E}) → a