
PDF and CDF of Standard Normal Distribution
Loading the math board and drawing, please wait…
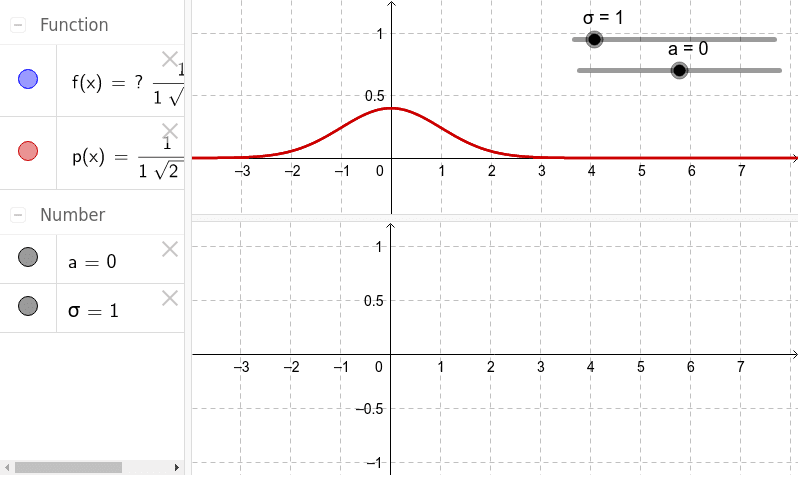
This example demonstrates the probability density function (PDF) and cumulative distribution function (CDF) of the standard normal distribution, highlighting its key properties such as symmetry, mean, and median. It involves core mathematical concepts in probability & statistics, including normal distribution, function graphing, and visualization. The construction uses GeoGebra objects like constants (a), standard deviation (σ), probability values (p), coordinate points (c_1, c_2), and functions (f). Suitable for high school and above students learning probability theory and statistical visualization.
GeoGebra Commands & Parameters
Numeric a(0.0)Numeric σ(1.0)p(x) = (1 / ((σ * sqrt((2 * π)))) * ℯ^((-((x - a)^(2) / ((2 * σ^(2)))))))Numeric c_1(0.0)Numeric c_2(0.0)f(x) = Integral[p] + 0.5
AI Drawing Prompt Reference
Plot the probability density function (PDF) and cumulative distribution function (CDF) of the standard normal distribution. Set the mean a to 0 and the standard deviation σ to 1. Then, use the formula to draw the PDF p(x) and calculate the CDF f(x) as the integral of p(x) plus 0.5. Highlight the symmetry, mean, and median of the function.
The prompt above was compiled from the original drawing commands and is for reference only.