
Geometric Distribution PDF and CDF Visualization
Loading the math board and drawing, please wait…
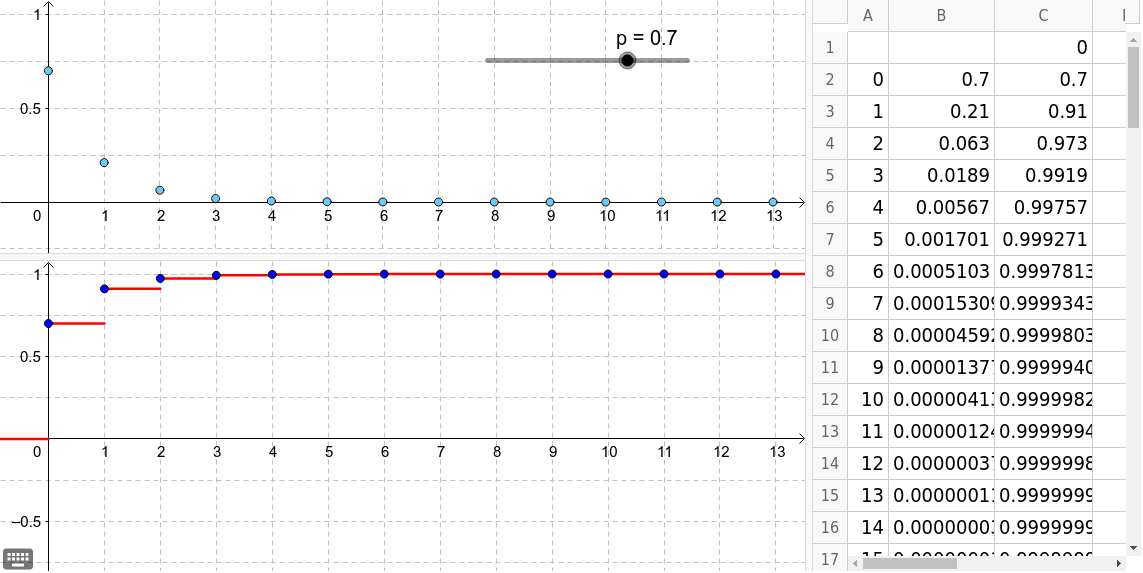
This example demonstrates the geometric shapes of the Probability Density Function (PDF) and Cumulative Distribution Function (CDF) of a geometric distribution through dynamic geometry. Key math concepts include probability & statistics, function graphing, standard deviation, and similar triangles. GeoGebra commands like Ray and Sequence are used to construct points, polygons, and cuboids, making it suitable for high school students and math enthusiasts to understand geometric representations of probability distributions.
GeoGebra Commands & Parameters
Ray((0, 0), (-10, 0)) → aRay((n, 1), (1000, 1)) → bSequence(Segment[(i - 1, Element[листа5, i]), Point[Circle[(i, Element[листа5, i]), 0]]], i, 0, n) → листа6