
Parts of Waves
Loading the math board and drawing, please wait…
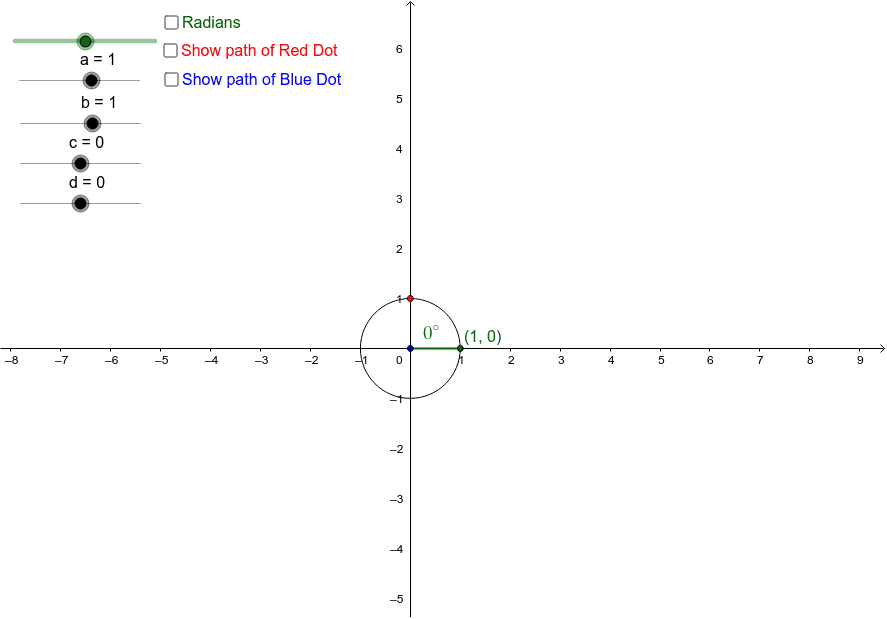
This GeoGebra applet helps students recognize how sine and cosine functions are generated from the x and y coordinates of points on a circle. It involves core trigonometry concepts and uses commands like Point, Circle, Ray, Intersect, Segment to construct these functions. Suitable for high school math education and learning.
GeoGebra Commands & Parameters
Point(xAxis) → CCircle(B, a) → hRay(B, A) → i_1Intersect(h, i_1, 1) → DRay(B, F) → i_2Intersect(h, i_2, 1) → GSegment(B, D) → g_1Segment(B, G) → g_2FractionText(n) → frLocus(S_1, n) → loc1Locus(S, n) → loc2CurveCartesian((((a * 0.15) * t) * cos((t * π))), (((a * 0.15) * t) * sin((t * π))), t, 0, n) → α_+CurveCartesian((((a * 0.15) * t) * cos(((-t) * π))), (((a * 0.15) * t) * sin(((-t) * π))), t, 0, (-n)) → α_-Segment((0, 0), H) → f
AI Drawing Prompt Reference
Draw a coordinate system with a point on the x-axis. Draw a circle centered at this point. Draw two rays from the center to points on the circle, forming two intersections. Connect the center to these intersection points with line segments. Plot the paths traced by these points as they move along the circle, representing sine and cosine functions. Finally, draw the sine function curve using the path traced by one of the points.
The prompt above was compiled from the original drawing commands and is for reference only.