
Partitioning a Line Segment: Geometry Constructions and Perimeter Change
Loading the math board and drawing, please wait…
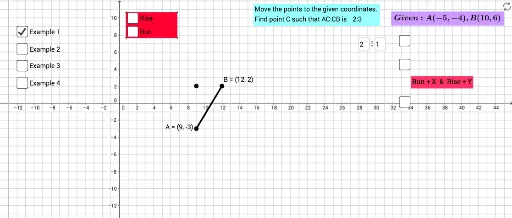
This GeoGebra example demonstrates how to partition a line segment using interactive geometric rules, revealing how constructed shapes and measured quantities vary with the partition. The key ideas include line-segment partitioning, perimeter as a geometric measure derived from the partition points, and an intuitive bridge to calculus via the notion of change rate (derivative). Construction is organized with core commands: Segment to set the main line-segment geometry, Polygon to form polygons by connecting partition points, and Textfield/FractionText to enter parameters and display partition ratios and fractional results with labeled annotations. The model uses multiple points (e.g., A, B, C, D, E, F plus intermediate partition points such as I and c_1, d_1, e_1, f_1) along with interface objects like a control button (button1) and auxiliary variables to support interactive exploration. Suitable for secondary to early college geometry, geometric construction practice, and introductory calculus/perimeter-optimization discussions.
GeoGebra Commands & Parameters
Segment(A, I) → jSegment(I, B) → kSegment(A, B) → gPolygon(C, D, E, F) → poly1, c_1, d_1, e_1, f_1Textfield(w) → InputBox2Textfield(text5) → InputBox3Textfield(r) → InputBox1Textfield(r) → InputBox4FractionText(f) → text11FractionText(o) → text13FractionText(p) → text14FractionText(q) → text15FractionText(s) → text16
AI Drawing Prompt Reference
Draw a main line segment AB and choose a midpoint I on it so that it is partitioned into two subsegments AI and IB. Show the whole segment AB together with the partitioned structure implied by point I. Using four points C, D, E, and F, connect them to form a polygon, reflecting how the partition relates to the constructed shape. Add several input fields to enter parameters such as w and text5 and additional ratio-related values like r, then display multiple fraction readouts to label the partition-dependent quantities (several separate fractional annotations). The figure should support exploration of how changing the partition affects the measured geometric quantities tied to the perimeter/change rate idea.
The prompt above was compiled from the original drawing commands and is for reference only.