
Partial Derivatives: Visualizing Tangent Slopes on a Surface
Loading the math board and drawing, please wait…
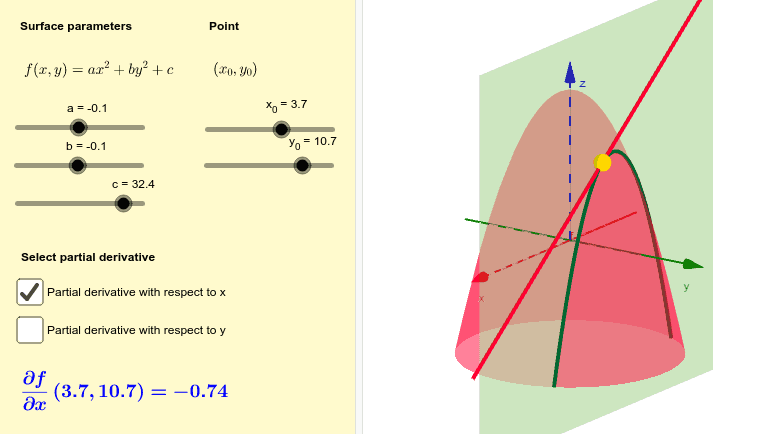
This GeoGebra example dynamically illustrates the geometric meaning of partial derivatives for a two-variable function, showing the slopes of tangent lines along the x- and y-axes at a chosen point. Core concepts include partial derivatives, tangent planes, directional derivatives, and local linear approximation of surfaces. Construction details: the IntersectPath command creates intersection curves between the surface and vertical planes, Vector draws direction vectors, and Line constructs tangent lines. Sliders control the point (x0, y0), updating the displayed values of PartialX and PartialY in real time. Suitable for university-level calculus or multivariable calculus courses, as well as advanced high school enrichment, this tool helps students intuitively grasp how partial derivatives measure the rate of change along coordinate axes.
GeoGebra Commands & Parameters
IntersectPath(plane1, f) → curve1Vector((1, 0, ((2 * a) * x_0))) → u1Line(A, u1) → l1IntersectPath(plane2, f) → curve2Vector((0, 1, ((2 * b) * y_0))) → u2Line(A, u2) → l2
AI Drawing Prompt Reference
Create a 3D surface plot showing the geometric meaning of partial derivatives at a point. Two vertical planes, one parallel to the x-axis and one to the y-axis, intersect the surface to form two curves. At a chosen point on the surface, draw tangent lines along each curve, with direction vectors whose lengths represent the slopes. Use sliders to move the point and update the tangents, vectors, and displayed partial derivative values in real time.
The prompt above was compiled from the original drawing commands and is for reference only.