
Partial and Direct Variation: Interactive Exploration
Loading the math board and drawing, please wait…
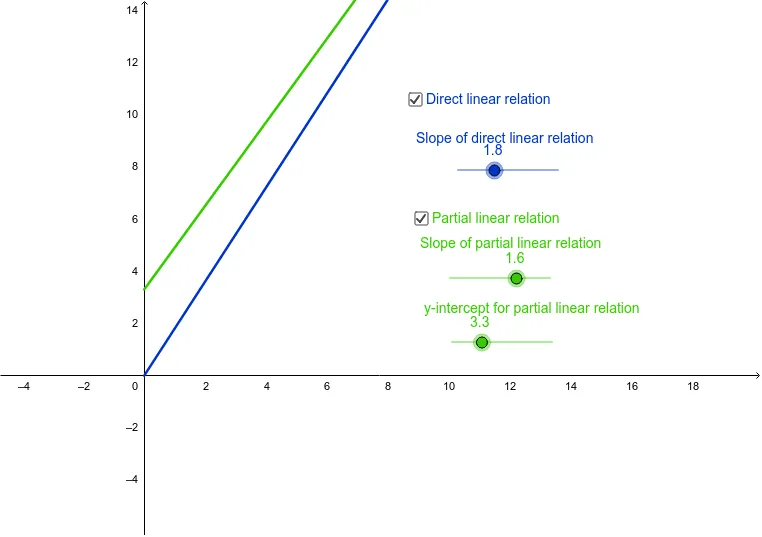
This GeoGebra example demonstrates the difference between partial variation and direct variation through interactive sliders, showing how the intercept and slope affect a linear function's graph. Core mathematical concepts include linear functions, proportional relationships, slope, intercept, and graph transformations. Construction details: The Ray command is used to create rays, with objects like SlopePartial, SlopeDirect, and intercept defined; sliders control parameters to dynamically update points A, B, E, F and text labels text1, text2, text3, while rectangular boxes (partialbox, directbox) help compare the two cases. Suitable for middle school to high school students learning functions and ratios, as well as for classroom demonstrations to clarify why direct variation passes through the origin while partial variation does not.
GeoGebra Commands & Parameters
Ray(B, A) → partialRay(F, E) → direct_1
AI Drawing Prompt Reference
Draw a coordinate plane comparing partial and direct variation. Use two sliders to control slope and intercept, dynamically adjusting two rays: one ray starts from an intercept point, the other from the origin, with the same slope but different intercepts. Label the slope and intercept values near the rays, and use two semi-transparent rectangular boxes to enclose each ray, highlighting that partial variation does not pass through the origin while direct variation does. The graph should clearly show linear function translation and proportional relationships, suitable for classroom demonstration.
The prompt above was compiled from the original drawing commands and is for reference only.