
Park High School Student Population Trend
Loading the math board and drawing, please wait…
In collections
UCSS Secondary Math I Unit 4 Lesson 2
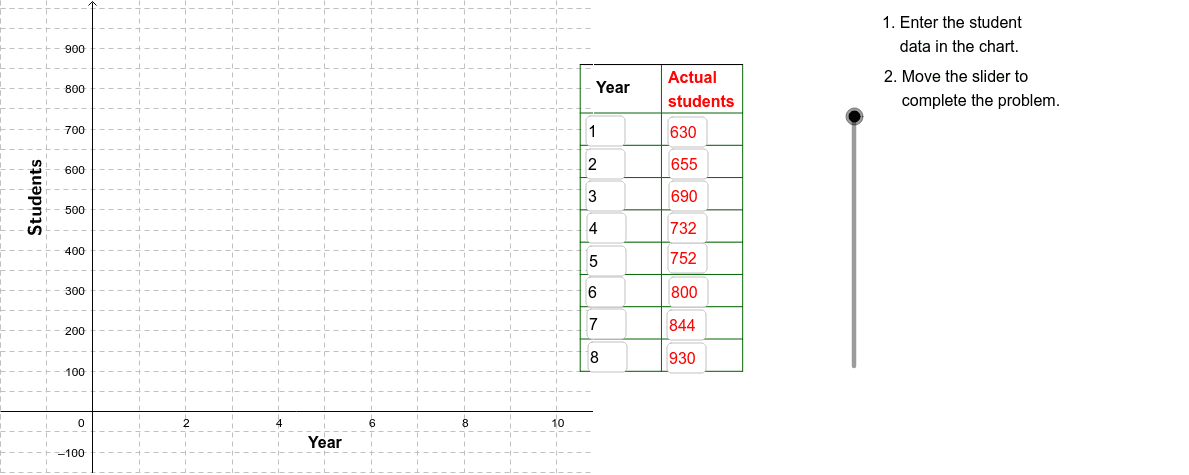
This example demonstrates the trend of student population at Park High School over the past 8 years. It involves core mathematical concepts such as exponential functions, scatter plots, and data fitting. Using GeoGebra commands like Corner, Textfield, Sequence, Segment, and Polygon, the data changes can be visually represented. Suitable for middle school mathematics education.
GeoGebra Commands & Parameters
Corner(2) → Corn2Corner(3) → Corn3Textfield(A2) → InA2Textfield(A3) → InA3Textfield(A4) → InA4Textfield(A5) → InA5Textfield(A6) → InA6Textfield(A7) → InA7Textfield(A8) → InA8Textfield(A9) → InA9Textfield(B9) → InB9Textfield(B8) → InB8Textfield(B7) → InB7Textfield(B6) → InB6Textfield(B5) → InB5Textfield(B4) → InB4Textfield(B3) → InB3Textfield(B2) → InB2Sequence(Segment[(10.5, 100 + (80 * j)), (14, 100 + (80 * j))], j, 0, 8) → LnListSequence(Segment[(14, 100 + (80 * j)), (16, 100 + (80 * j))], j, 0, 8) → LnList3Sequence(Segment[(10.5 + (1.75 * j), 100), (10.5 + (1.75 * j), 860)], j, 0, 2) → LnList2Segment((10.5, 860), (14, 860)) → Top1Segment((14, 860), (16, 860)) → Top2Segment((16, 100), (16, 860)) → Side1Polygon((0.5 * Corner[1]) + (0.5 * Corner[2]), Corner[2], Corner[3], (0.5 * Corner[3]) + (0.5 * Corner[4])) → poly1, b, c, d, eVerticalText("Students") → Students
AI Drawing Prompt Reference
Create a graph showing the trend of student population at a high school over 8 years, including a scatter plot and fitted curve, with line segments indicating data changes and labeled key points. The background should be a grid, enclosed by top and side line segments, depicting an overall upward trend.
The prompt above was compiled from the original drawing commands and is for reference only.