
Parametric Investigation: Visualizing Curves Across Math Topics
Loading the math board and drawing, please wait…
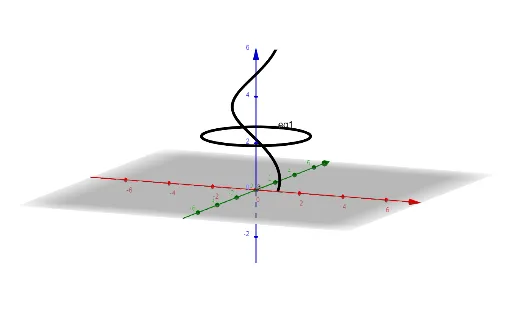
This GeoGebra example demonstrates a parametric investigation environment built with the CurveCartesian command, where varying parameters a and s dynamically generate curves that connect to squares, exponential functions, linear equations, probability, and differential equations. The core mathematical concept is parametric equations, focusing on how parameters control curve shape and evolution. The construction uses the CurveCartesian command to define the parametric curve, with objects a, s, and eq1 serving as adjustable parameters and constraints. Suitable for high school to early college students, this tool helps learners grasp the essence of parametric representation, observe how parameter changes transform graphs, and explore interdisciplinary links among algebra, geometry, and analysis. It is ideal for classroom demonstrations or self-directed exploration of parametric phenomena.
GeoGebra Commands & Parameters
CurveCartesian((cos(t), sin(t), t), t, 0, (2 * 3.141592653589793)) → a
AI Drawing Prompt Reference
Draw a parametric curve with x = cos(t) and y = sin(t), where t ranges from 0 to 2π. Adjust t to observe the curve's changes. This curve is a unit circle, controlled by parameter t.
The prompt above was compiled from the original drawing commands and is for reference only.