
Parametric Curves Settings
Loading the math board and drawing, please wait…
In collections
Learn GeoGebra Classic
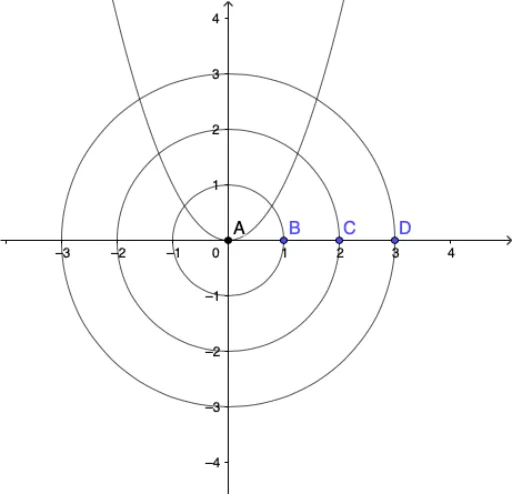
This example demonstrates how to draw parametric curves using GeoGebra. It involves parametric equations, arithmetic operations, and statistical concepts such as means and standard deviation. By adjusting parameters, you can observe changes in the curve. The example uses objects c, d, e, f, A, B, C, and D.
GeoGebra Commands & Parameters
x^(2) + y^(2) = 1x^(2) + y^(2) = 4x^(2) + y^(2) = 9f(x) = x^(2)(0, 0)(1, 0)(2, 0)Point D(3, 0)
AI Drawing Prompt Reference
Draw three concentric circles centered at the origin with radii 1, 2, and 3. Also, plot the parabola y=x^2 and mark the points (0,0), (1,0), (2,0), and (3,0) on the x-axis. Observe how parameter changes affect the curves.
The prompt above was compiled from the original drawing commands and is for reference only.