
Parametric Curve Example
Loading the math board and drawing, please wait…
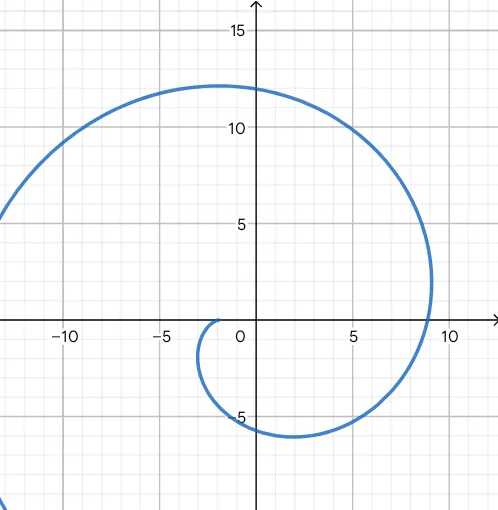
This example demonstrates how to plot a parametric curve using parametric equations. Key math concepts include parametric equations, coordinate geometry, and function graphing. The construction uses the GeoGebra 'CurveCartesian' command with parameters a, b, c. Suitable for high school students learning about parametric equations applications.
GeoGebra Commands & Parameters
CurveCartesian((b * cos(t)) + ((b * t) * sin(t)), (b * sin(t)) - ((b * t) * cos(t)), t, 0, a) → c
AI Drawing Prompt Reference
Plot a parametric curve using equations involving cosine and sine functions with parameters a, b, c, showing their relationship. The curve is defined by combining these functions with t ranging from 0 to a, controlled by parameter b, creating a spiral-like shape that evolves over the parameter range.
The prompt above was compiled from the original drawing commands and is for reference only.