
Parameterized Modeling of Berlin Curve Building
Loading the math board and drawing, please wait…
In collections
Portugal is great
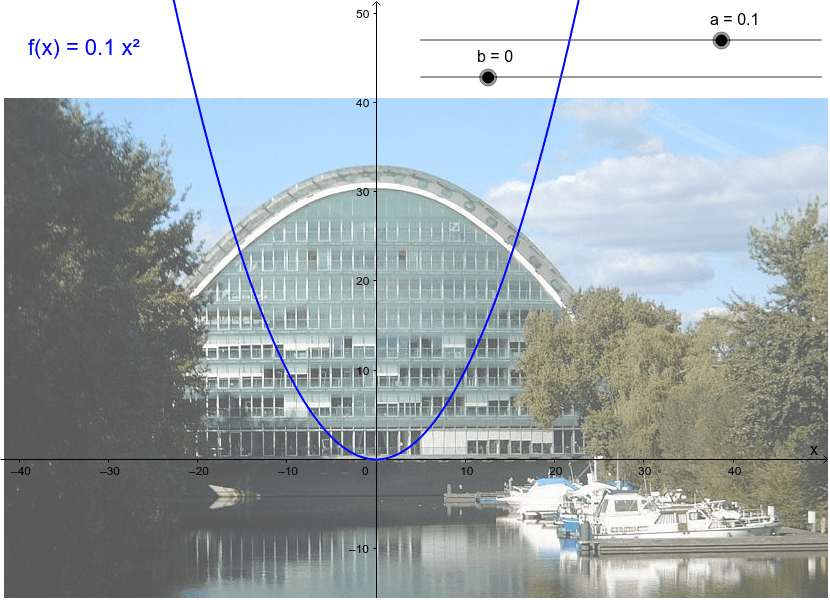
This example demonstrates how to fit a quadratic function to the profile of the Berlin Curve building by adjusting parameters. Key math concepts include quadratic functions, parameter tuning, symmetry, and analytical geometry. Construction highlights involve using GeoGebra commands like Textfield for objects a, b, f, and Textfeld1, pic1, text1. Suitable for high school mathematics education, linking function models with real-world architecture.
GeoGebra Commands & Parameters
Textfield(f) → Textfeld1
AI Drawing Prompt Reference
Draw the profile of the Berlin Curve building using a quadratic function to fit its shape, showing how the function model matches the actual building by adjusting parameters. Include a graph of the quadratic function and text labels for parameters a, b, and function f, which are dynamically adjusted via sliders to demonstrate parameter optimization and symmetry.
The prompt above was compiled from the original drawing commands and is for reference only.