
Parabola with Tangent, Boxplot, and Binomial Distribution
Loading the math board and drawing, please wait…
In collections
Quadratics - Parabolas
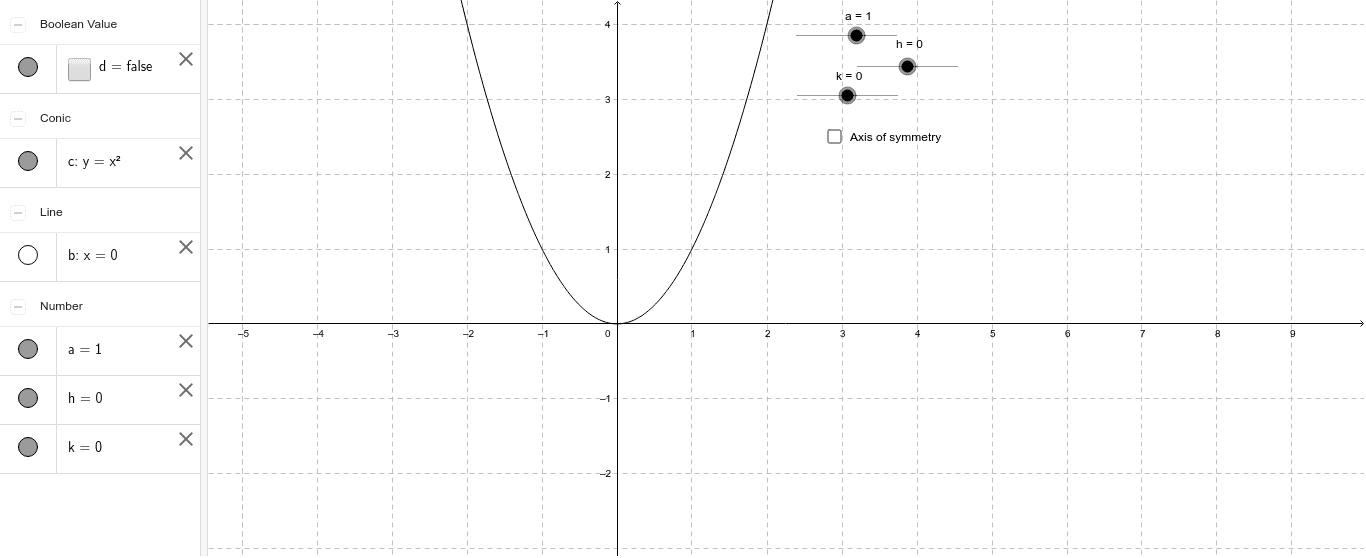
This GeoGebra example dynamically demonstrates the parabola and its properties while integrating tangent lines, boxplots, statistics, and binomial distribution. The core concept is the quadratic function in vertex form y=a(x-h)^2+k, where parameters a, h, k control the opening, width, and vertex position. The tangent line at a point on the parabola is constructed, illustrating the derivative and slope. Construction uses sliders or input boxes for parameters a, h, k, and auxiliary objects c, d, b to define the tangent and related geometric elements. Additionally, a boxplot visualizes data distribution, and a binomial distribution function is included for probability statistics. Suitable for high school and early college students to explore quadratic transformations, tangent geometry, and statistical visualization in an integrated manner, serving as a cross-topic teaching resource.
GeoGebra Commands & Parameters
Numeric a(1.0)Numeric h(0.0)Numeric k(0.0)y = (a * (x - h)^(2)) + kBoolean d(false)x = h
AI Drawing Prompt Reference
Draw a parabola with its vertex at the origin and opening upwards, then adjust parameters a, h, and k to change the size, direction, and vertex position of the parabola. Add a tangent line at a specific point on the parabola to illustrate the relationship between the slope and the derivative. Also, draw a boxplot to show the data distribution and add a binomial distribution function to represent probability statistics.
The prompt above was compiled from the original drawing commands and is for reference only.