
Parabola Vertex Form Dynamic Demo
Loading the math board and drawing, please wait…
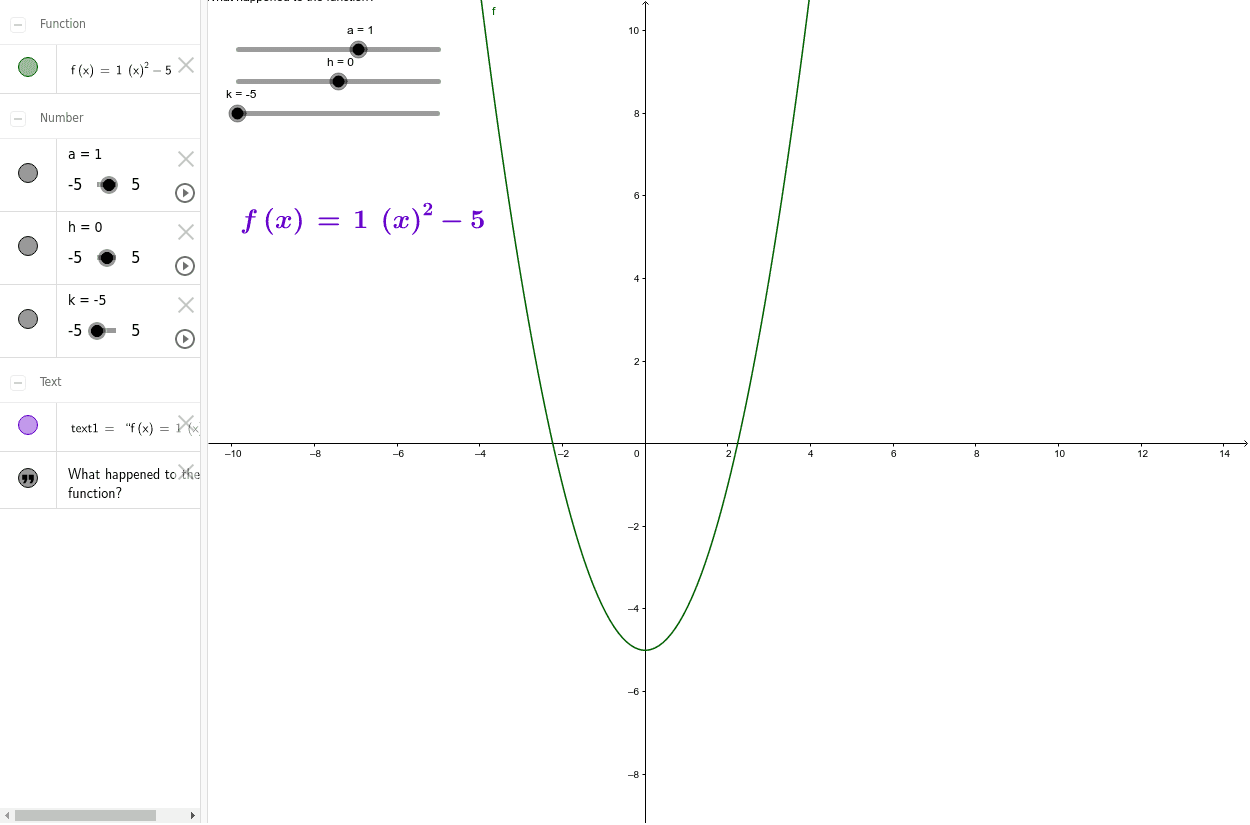
① This example dynamically demonstrates how the graph of the parabola in vertex form y = a(x‑h)² + k changes as the parameters a, h, and k vary. ② Core mathematical concepts include quadratic functions, vertex coordinates, direction and width of opening, and translation/scaling transformations. ③ Construction highlights: GeoGebra's LaTeX command creates formula text; parameters a, h, k are defined as slider objects; the function f(x)=a*(x-h)^2+k is built; text1 and text2 display the vertex coordinates and the equation. ④ Suitable for high‑school mathematics (compulsory/optional modules) on function graphs, as well as middle‑school algebra enrichment or teacher lesson preparation.
GeoGebra Commands & Parameters
LaTeX(f, true, true) → text1
AI Drawing Prompt Reference
Draw a vertex‑form parabola y = a(x‑h)² + k with three adjustable sliders for a (controlling opening direction and width), h (horizontal translation), and k (vertical translation); the curve updates instantly as the sliders change, and the figure displays the vertex coordinates (h, k) alongside the current full equation rendered as a formula. The sliders are continuous, allowing smooth exploration of how each parameter stretches, flips, or shifts the parabola.
The prompt above was compiled from the original drawing commands and is for reference only.