
Parabola Tracer by Erwin Zúñiga Torillo
Loading the math board and drawing, please wait…
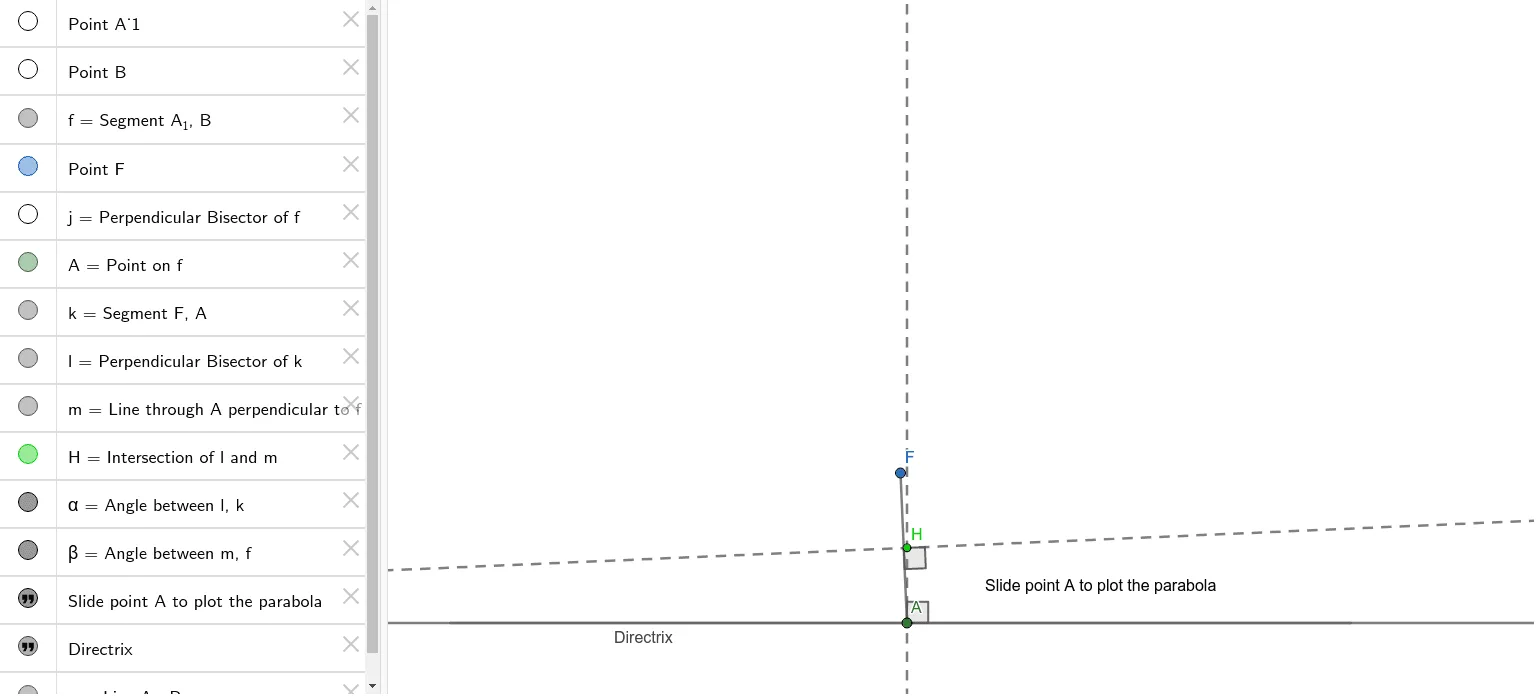
This example demonstrates how to use GeoGebra to trace a parabola. Key mathematical concepts include the definition of a parabola, translation, and scatter plot. Using commands such as Segment, LineBisector, Point, OrthogonalLine, Intersect, Angle, and Line, the construction of the parabola and related elements is illustrated. Suitable for high school mathematics education and learning.
GeoGebra Commands & Parameters
Segment(A_1, B) → fLineBisector(f) → jPoint(f) → ASegment(F, A) → kLineBisector(k) → lOrthogonalLine(A, f) → mIntersect(l, m) → HAngle(l, k) → αAngle(m, f) → βLine(A_1, B) → g
AI Drawing Prompt Reference
Draw a parabola. The parabola is formed by the intersection of a line and a line perpendicular to it. The starting and ending points are key points on the parabola. Ensure the drawing is clear and simple, suitable for mathematical education.
The prompt above was compiled from the original drawing commands and is for reference only.