
Parabola Curve Example
Loading the math board and drawing, please wait…
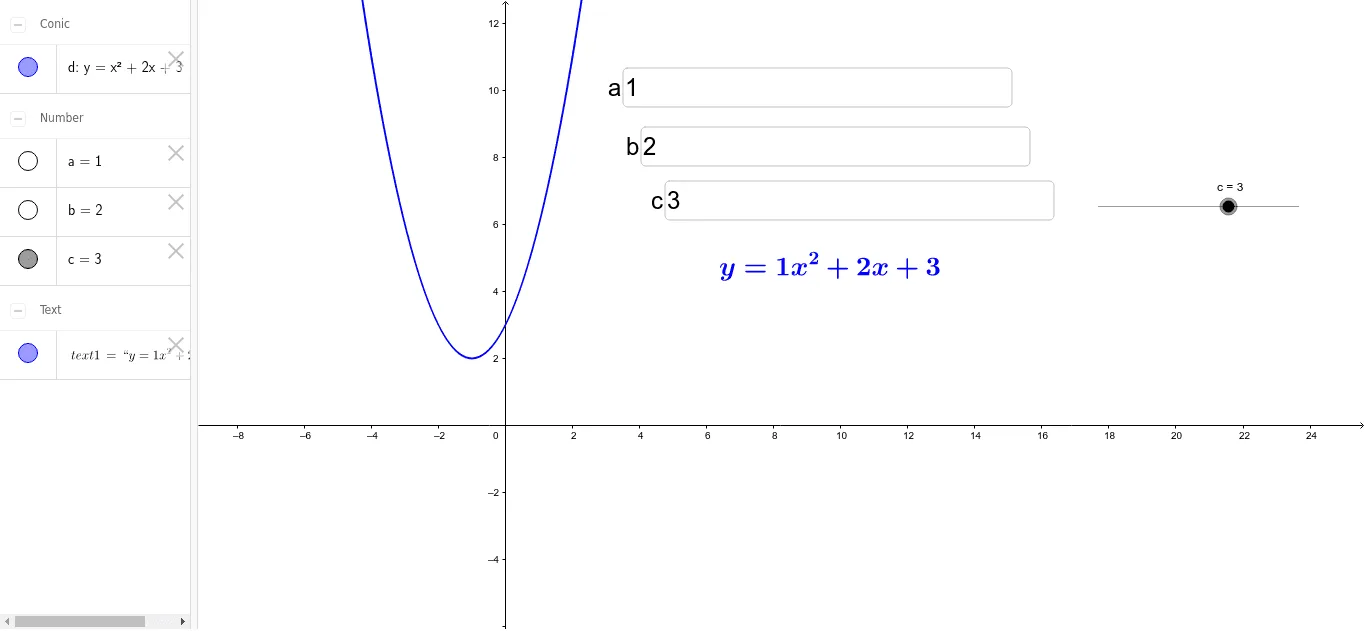
This example demonstrates the plotting and dynamic manipulation of a parabola curve. It involves core mathematical concepts such as functions, coordinate geometry, and vectors. Constructed using GeoGebra commands like Textfield, variables a, b, c, d, and InputBoxes for parameter input and display. Suitable for high school and above mathematics education, focusing on function graphing and parameter exploration.
GeoGebra Commands & Parameters
Textfield(a) → InputBox1Textfield(b) → InputBox2Textfield(c) → InputBox3
AI Drawing Prompt Reference
Draw a parabola and use the input boxes to adjust the parameters a, b, and c to change the shape of the parabola. First, enter values for a, b, and c, then plot the function y=ax^2+bx+c.
The prompt above was compiled from the original drawing commands and is for reference only.