
Logarithmic Functions and Mathematical Concepts Demo
Loading the math board and drawing, please wait…
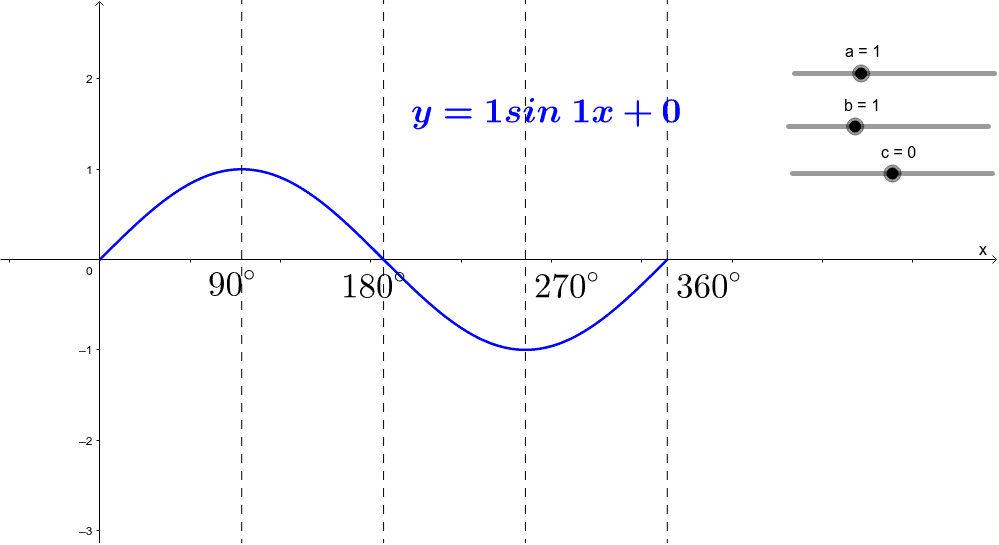
This example demonstrates the graph of logarithmic functions and related mathematical concepts. Core math concepts include logarithmic functions, exponents, addition, and confidence intervals. It uses GeoGebra commands/objects: a, b, text1, text2, text3, text4, g, h, i, j, p, c, text5, f. Suitable for high school mathematics teaching and learning to understand the properties of logarithmic functions and statistical applications.
GeoGebra Commands & Parameters
Numeric a(1.0)Numeric b(1.0)Line g(1.0, 0.0, -1.5707963267948966)Line h(1.0, 0.0, -3.141592653589793)Line i(1.0, 0.0, -4.71238898038469)Line j(1.0, 0.0, -6.283185307179586)p(x) = If[0 ≤ x ≤ 6.28319,sin(x)]Numeric c(0.0)f(x) = If[0 ≤ x ≤ 6.28319,(a * sin((b * x))) + c]
AI Drawing Prompt Reference
Draw a sine function from 0 to 2π, then overlay a logarithmic function that can be adjusted by sliders for amplitude a and frequency b. First, draw the sine curve from 0 to 2π, then use sliders to dynamically adjust the amplitude and frequency, and finally plot the logarithmic function based on these values.
The prompt above was compiled from the original drawing commands and is for reference only.