
Paper Wad Trajectory Analysis
Loading the math board and drawing, please wait…
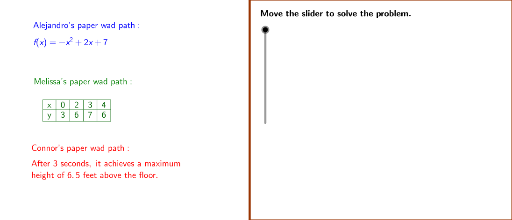
This example demonstrates three students shooting paper wads with a rubber band at a trash can in the front of the room. By analyzing the trajectory of the paper wads, parabolic characteristics can be observed. Key mathematical concepts include parabolas, functions, and stochastic processes. Commands used include If, Polygon, TableText, Max, Min, etc., suitable for high school mathematics education.
GeoGebra Commands & Parameters
If(gHt1 ≟ 0, 1, gHt1) → ga1If(fa ≟ 0, 1, fa) → fa1If(ConT ≟ 0, 1, ConT) → MaskTerm1Polygon((Edge, y(Corner[1])), Corner[2], Corner[3], (Edge, y(Corner[4]))) → Mask, a, b, c, dTableText({{x, gVertx - 3, gVertx - 1, gVertx, gVertx + 1}, {"y", gHt3, gHt2, gHt1, gHt2}}, "c|_") → MelissaTableMax({Vay, ConHt, gHt1}) → VHighMin({Vay, ConHt, gHt1}) → VLowIf(Vay > Max[gHt1, ConHt], Max[gHt1, ConHt], If[Vay < Min[gHt1, ConHt], Min[gHt1, ConHt], Vay]) → VMidIf(Vay > gHt1, If[Vay > ConHt, 1, 3], If[gHt1 > ConHt, 2, 3]) → NameChoice
AI Drawing Prompt Reference
Illustrate the trajectories of paper wads shot by three students with rubber bands toward a trash can in front of a classroom, highlighting parabolic characteristics, marking the highest and lowest points, and displaying coordinates in a table for different paper wads.
The prompt above was compiled from the original drawing commands and is for reference only.