
Oscillation of sin(1/x) and Its Derivative
Loading the math board and drawing, please wait…
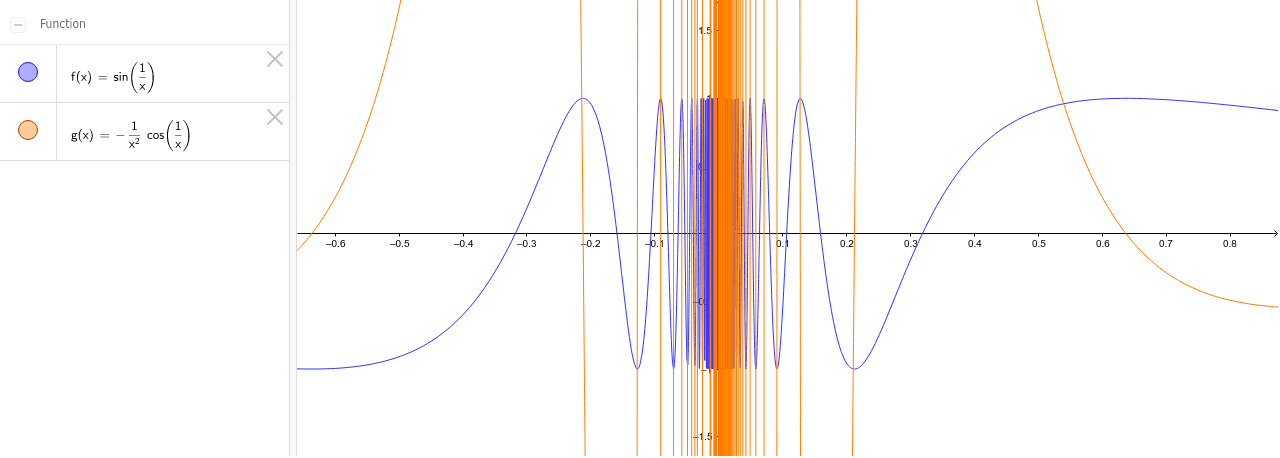
This example demonstrates the rapid oscillation of the function f(x) = sin(1/x) as x approaches zero, alongside the behavior of its derivative. The core mathematical concepts involved include composite functions, trigonometric properties, limits, and the fundamental definition of derivatives. The construction utilizes the GeoGebra 'Derivative' command applied to function object f to generate the derivative function g, allowing for a side-by-side visual comparison of the original function's frequency and the derivative's amplitude. This resource is ideal for high school advanced mathematics or college-level calculus courses focusing on continuity, differentiability, and the analysis of oscillating functions.
GeoGebra Commands & Parameters
Derivative(f) → g
AI Drawing Prompt Reference
Draw the graphs of the function f(x) = sin(1/x) and its derivative g(x). As x approaches zero, the original function f(x) exhibits rapid oscillations, which should be clearly shown in the graph. The derivative g(x) should display its amplitude in relation to the oscillations of f(x). Arrange the two functions side-by-side for a visual comparison of their behavior near x = 0. The graph should help illustrate concepts of continuity and differentiability through the oscillation of f(x) and the amplitude of g(x).
The prompt above was compiled from the original drawing commands and is for reference only.