
Ordering Rational and Irrational Numbers by John Golden
Loading the math board and drawing, please wait…
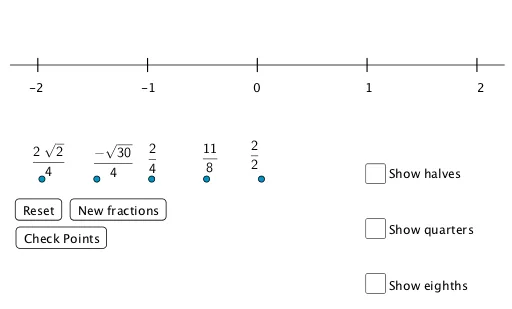
This example demonstrates how to compare the sizes of rational and irrational numbers using GeoGebra. Through visual methods, users can intuitively understand the positional relationships of different types of real numbers on the number line. The core mathematical concepts involved include real number classification, number line representation, and inequalities. The construction highlights the use of GeoGebra commands such as Sequence and Segment, along with objects like list7, list6, dens, error, list6_1, H, list7_1, flist, G, F, E, D, list8, toosmall, toobig, A, B, f_1, C, list1, list2, list3, list4, list5, a, b, c, button1, n, p, I, J, K, L, M, button2, list6_0, list7_0, text7, text6. It is suitable for middle school and above, used for real number learning and inequality teaching.
GeoGebra Commands & Parameters
Sequence(RandomElement[dens], i, 1, 5) → list6_1Sequence(Random[(-2 * Element[list6_1, i]), (2 * Element[list6_1, i])], i, 1, 5) → list7_1Sequence(Element[list7, i] / Element[list6, i], i, 1, 5) → flistSequence((-x(Element[list8, i])) + Element[flist, i] > error, i, 1, 5) → toosmallSequence(x(Element[list8, i]) - Element[flist, i] > error, i, 1, 5) → toobigSegment(A, B) → f_1Sequence(Segment[(-2 + i, -0.12), (-2 + i, 0.12)], i, 0, 4, 1) → list1Sequence(Text[-2 + i, (x(C) + (1.02 * i), y(C))], i, 0, 4) → list2Sequence(Segment[(-2 + i, -0.11), (-2 + i, 0.11)], i, 0, 4, 0.5) → list3Sequence(Segment[(-2 + i, -0.09), (-2 + i, 0.09)], i, 0, 4, 0.25) → list4Sequence(Segment[(-2 + i, -0.07), (-2 + i, 0.07)], i, 0, 4, 0.125) → list5Sequence((RandomElement[{-1, 1}] * sqrt(Random[1, (2 * Element[list6_1, i]^(2))])), i, 1, 5) → list9Sequence(RandomElement[{Element[list7_1, i], Element[list9, i]}], i, 1, n) → list7_2
AI Drawing Prompt Reference
Draw a horizontal number line from -2 to 2 with integer labels and finer tick marks at halves, quarters, and eighths. Randomly place five rational points as short vertical segments on the line, and five irrational points (as positive or negative square roots of random values) marked with distinct symbols or colors. Label each point with its value, and include error-bound indicators showing whether points fall within or outside a target interval. The scene visually compares rational and irrational number positions on the line.
The prompt above was compiled from the original drawing commands and is for reference only.