
Orange Slice-2
Loading the math board and drawing, please wait…
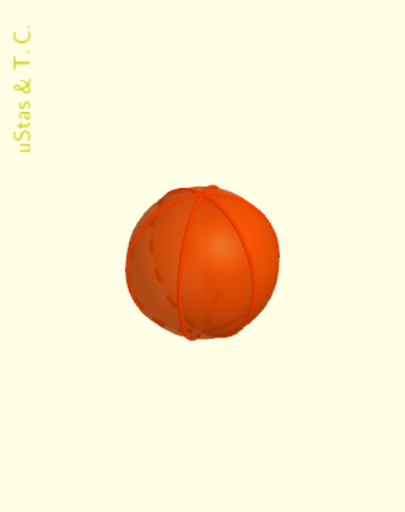
This example demonstrates a rotating 3D orange slice visualization with integrated mathematical elements. Core concepts include sphere, circle, hypergeometric distribution, probability, logarithm, and special points. Construction highlights the use of commands like RotateText, SelectedElement, Surface, Arc, Sequence, Rotate, Line in GeoGebra. Suitable for high school and above students to visually understand spatial geometry and probability statistics.
GeoGebra Commands & Parameters
RotateText("uStas\;\&\;T.C.", 90°) → надпись01SelectedElement(sp1) → nSurface(((scaLe * cos(k)) * cos(t)), ((scaLe * cos(k)) * sin(t)), zQ + (scaLe * sin(k)), k, ((-π)) / 2, π / 2, t, 0, π / n) → c1Arc(Circle[Q, scaLe, yAxis], (0, 0, zQ + scaLe), (0, 0, zQ - scaLe)) → ψSequence(Rotate[ψ, (t * π / n), zAxis], t, 2, (2 * n) - 1) → ψ2Rotate(ψ, π / n, zAxis) → ωSequence(Rotate[c1, (t * π / n), zAxis], t, 1, (2 * n) - 1) → sp2Line(((scaLe * sin(π / ((2 * n)))), ((-scaLe) * cos(π / ((2 * n)))), zQ - scaLe), (((-scaLe) * sin(π / ((2 * n)))), (scaLe * cos(π / ((2 * n)))), zQ - scaLe)) → aRotate(c1, α, a) → c3Sequence(Rotate[c3, (t * π / n), zAxis], t, 1, (2 * n) - 1) → sp3Rotate(ψ, α, a) → ψ1Rotate(ω, α, a) → ω1Sequence(Rotate[ψ1, (t * π / n), zAxis], t, 1, (2 * n) - 1) → ψ3Sequence(Rotate[ω1, (t * π / n), zAxis], t, 1, (2 * n) - 1) → ω3
AI Drawing Prompt Reference
Create a rotating 3D orange slice visualization with integrated mathematical elements, featuring a sphere, circle, and probability concepts. Include rotating text and special points, generate the surface with parametric equations, and use rotation and sequence commands to create multiple slices and arcs, combining them into a complete orange slice model for high school and above students to understand spatial geometry and probability statistics.
The prompt above was compiled from the original drawing commands and is for reference only.