
One-Step Equations Visualization
Loading the math board and drawing, please wait…
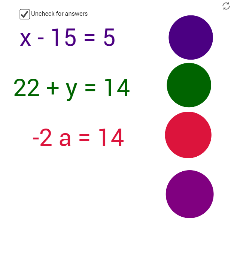
This example demonstrates how to dynamically visualize one-step equations and their geometric interpretations using GeoGebra. It involves core mathematical concepts such as equation solutions, geometric representations, random number generation, summation, and product operations. Key GeoGebra commands used include Random, Sum, Product, Circle, with objects like a, b, c, d, e, f, g, h, i, j, k, l. It is suitable for middle school and above students to understand the intuitive representation of equation solutions and basic GeoGebra operations.
GeoGebra Commands & Parameters
Random(4, 24) → aRandom(4, 24) → bSum({a, b}) → cRandom(4, 24) → dRandom(4, 24) → eSum({e, (-d)}) → fRandom(-12, 12) → gProduct({g, h}) → iProduct({g, j}) → kCircle(A, B) → pCircle(C, D) → qCircle(E, F) → rCircle(G, H) → s
AI Drawing Prompt Reference
Create a dynamic visualization for one-step equations, involving two randomly generated numbers whose sum forms a base for another number, combined with other random values to produce products, and finally use these values to draw four circles, illustrating the geometric interpretation of equation solutions.
The prompt above was compiled from the original drawing commands and is for reference only.