
Nth Roots of a Complex Number
Loading the math board and drawing, please wait…
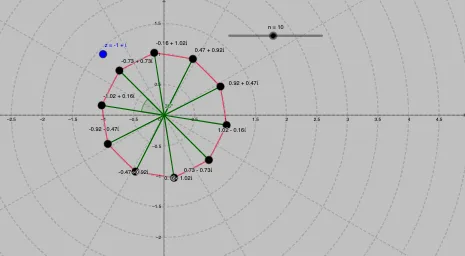
This example demonstrates how to plot all nth roots of a complex number and visually represents their distribution. Key math concepts include complex number modulus, argument, polar representation, nth root formulas, and similarity transformations. Construction involves commands like Length, Sequence, Segment, Angle, Element, with objects such as z, mod_z, arg_z, n, list1, etc. It is suitable for high school and above students to understand the connection between complex operations and geometric representations, and for teaching complex number theory.
GeoGebra Commands & Parameters
Length(z) → mod_zSequence((mod_z^(1 / n) * (cos(arg_z + ((2 * k) * π / n)) + (ί * sin(arg_z + ((2 * k) * π / n))))), k, 0, n - 1) → list1Sequence(Segment[Element[list1, k], Element[list1, k + 1]], k, 1, n - 1) → list2Segment(Element[list1, n], Element[list1, 1]) → aSequence(Segment[(0, 0), Element[list1, j]], j, 1, n) → list3Angle(Element[list3, 1], Element[list3, 2]) → αElement(list1, A1) → B1Element(list1, A2) → B2Element(list1, A3) → B3Element(list1, A4) → B4Element(list1, A5) → B5Element(list1, A6) → B6Element(list1, A7) → B7Element(list1, A8) → B8Element(list1, A9) → B9Element(list1, A10) → B10Element(list1, A11) → B11Element(list1, A12) → B12Element(list1, A13) → B13Element(list1, A14) → B14Element(list1, A15) → B15Element(list1, A16) → B16Element(list1, A17) → B17Element(list1, A18) → B18Element(list1, A19) → B19Element(list1, A20) → B20
AI Drawing Prompt Reference
Plot all nth roots of a complex number and show their distribution. First, draw the complex number z, then calculate its modulus mod_z and argument arg_z. Next, compute the nth roots and connect them to form a polygon. Finally, draw vectors from the origin to each nth root and label one angle α.
The prompt above was compiled from the original drawing commands and is for reference only.