
Normal vs. t Distributions: Parameter Effects Visualization
Loading the math board and drawing, please wait…
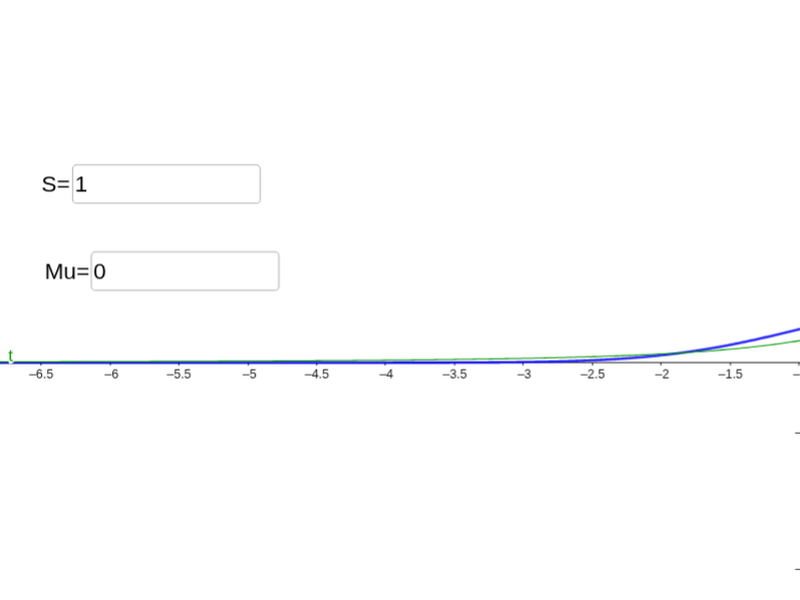
① This example dynamically displays the normal distribution and t-distribution curves, showing how input values of mean (mu), variance, and sample size affect their shapes and relative positions. ② Core mathematical concepts include normal distribution, t-distribution, degrees of freedom, probability density functions, central limit theorem, and differences in tail thickness. ③ Construction highlights: uses GeoGebra commands Normal and TDistribution to generate the curves, with Textfield input boxes (inputBox1, inputBox2) and a button (button1) for interactive parameter adjustment; objects m, s, f, n, t represent mean, standard deviation, function, sample size, and t-distribution object respectively, enabling parameter-driven dynamic updates. ④ Suitable for high school to university-level statistics education, helping students understand the relationship between t and normal distributions and the impact of sample size on inferential statistics, ideal for classroom demonstrations or self-directed exploration.
GeoGebra Commands & Parameters
Normal(m, s, x) → fTDistribution(n, x) → tTextfield(s) → inputBox1Textfield(m) → inputBox2
AI Drawing Prompt Reference
Draw curves for normal and t distributions to show how mean, variance, and sample size affect their shapes and positions. Use text boxes for mean and sample size input, and a slider for variance adjustment. Dynamically display the curves and label key mathematical concepts like probability density functions and degrees of freedom.
The prompt above was compiled from the original drawing commands and is for reference only.