
Normal Hypothesis Testing with Error Analysis
Loading the math board and drawing, please wait…
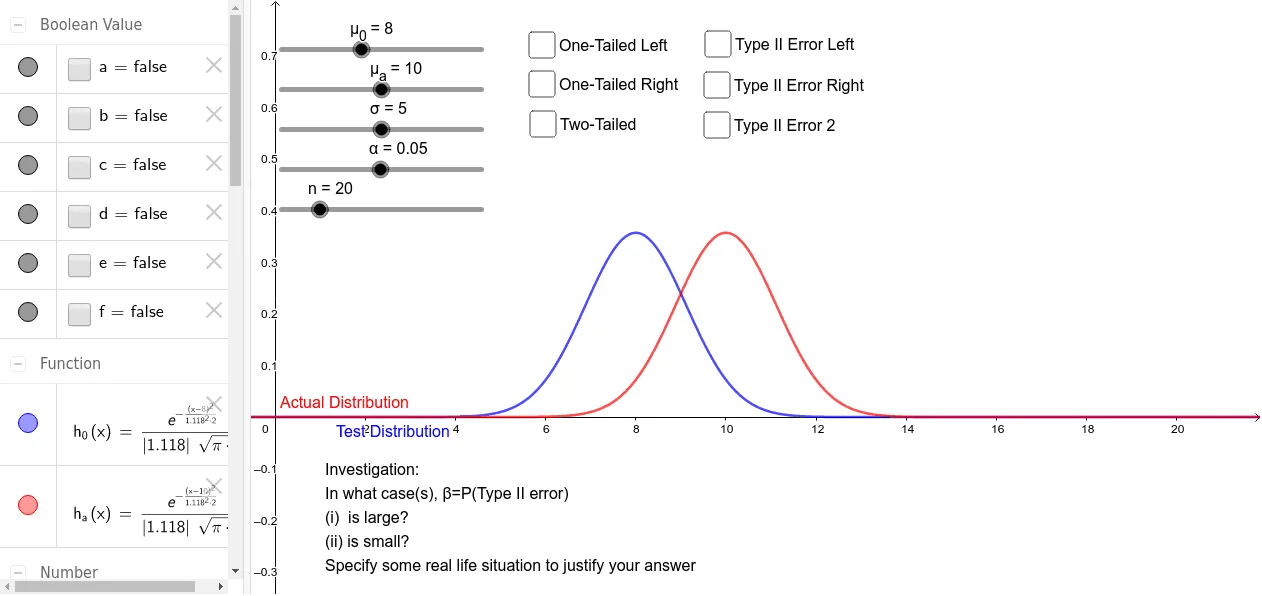
This example demonstrates the process of hypothesis testing for a normal distribution, visually showing critical regions and p-values to help understand Type I and Type II errors. Core mathematical concepts include normal distribution, critical values, p-values, and significance level. It uses GeoGebra commands like Normal, InverseNormal, and Integral, with objects such as n (sample size), σ (standard deviation), μ_0 (null hypothesis mean), and α (significance level). Suitable for high school students or beginners in statistics learning hypothesis testing methods.
GeoGebra Commands & Parameters
Normal(μ_0, σ / sqrt(n), x) → h_0Normal(μ_a, σ / sqrt(n), x) → h_aInverseNormal(μ_0, σ / sqrt(n), 1 - α) → z_αIntegral(h_0, z_α, μ_0 + (6 * σ)) → CR_RInverseNormal(μ_0, σ / sqrt(n), α) → z_α'Integral(h_0, μ_0 - (6 * σ), z_α') → CR_LIntegral(h_a, μ_0 - (6 * σ), z_α) → β_RIntegral(h_0, μ_0 - (6 * σ), InverseNormal[μ_0, σ / sqrt(n), α / 2]) → CR_22Integral(h_a, InverseNormal[μ_0, σ / sqrt(n), α / 2], InverseNormal[μ_0, σ / sqrt(n), 1 - α / 2]) → β_2Integral(h_a, InverseNormal[μ_0, σ / sqrt(n), α], μ_0 + (6 * σ)) → β_LIntegral(h_0, InverseNormal[μ_0, σ / sqrt(n), 1 - α / 2], μ_0 + (6 * σ)) → CR_21
AI Drawing Prompt Reference
Draw a normal distribution graph showing the null and alternative hypotheses, mark the critical regions and p-values under the significance level, differentiate the rejection and acceptance regions with different colors, and display the areas of Type I and Type II errors. Finally, highlight the areas of error probabilities under different conditions with shading.
The prompt above was compiled from the original drawing commands and is for reference only.