
Bias in Estimated Standard Deviations
Loading the math board and drawing, please wait…
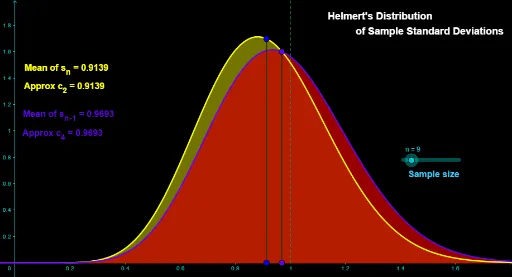
This example demonstrates the bias in estimated standard deviations across different sample sizes. It involves core mathematical concepts like standard deviation, hypothesis testing, calculus, optimization problems, continuity, and fractal geometry. The construction uses GeoGebra commands such as Segment, Integral, objects like n, f, B, A, a, obsmean, E, F, b, text elements, thearea, g, and others for visualization. It is suitable for high school and above, focusing on statistical bias and calculus applications.
GeoGebra Commands & Parameters
Segment(A, B) → aSegment(E, F) → bIntegral(f, 0, 2) → theareaSegment(C, D) → cIntegral(g, 0, 2) → thearea2