
Normal Distribution with Sliders
Loading the math board and drawing, please wait…
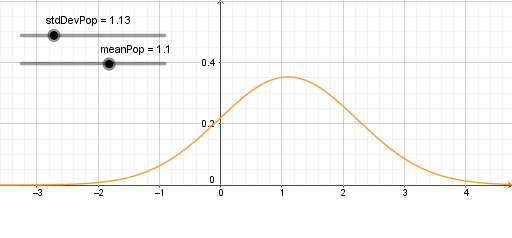
This example demonstrates the dynamic effect of the normal distribution curve as the mean and standard deviation change. It involves core mathematical concepts such as normal distribution, mean, standard deviation, and statistical graphs. The construction uses the GeoGebra command Normal to create the curve, with objects meanPop, stdDevPop, and A to control the mean and standard deviation sliders. It is suitable for high school students and math enthusiasts learning probability and statistics, providing an intuitive understanding of normal distribution properties.
GeoGebra Commands & Parameters
Normal(meanPop, stdDevPop, x) → A
AI Drawing Prompt Reference
Draw a normal distribution curve that can be adjusted by sliders for mean and standard deviation. First, set up sliders for mean and standard deviation, then use these sliders as parameters in the normal distribution command to draw the curve.
The prompt above was compiled from the original drawing commands and is for reference only.