
Normal Distribution Probability Calculation Practice
Loading the math board and drawing, please wait…
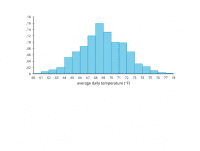
This GeoGebra example guides students through visualizing a normal distribution curve, adjusting the mean and standard deviation, and calculating probabilities over specific intervals. It demonstrates the practical application of probability density functions, standard normal transformation, and area-under-curve concepts. Construction uses GeoGebra commands such as NormalDistribution, Slider for mean and standard deviation, Probability tools, and shaded region visualization. Ideal for high school Algebra 2 or introductory statistics courses, it helps learners connect theoretical distributions with dynamic graphical representations and probability calculations.
AI Drawing Prompt Reference
Draw a normal distribution curve and adjust the mean and standard deviation using sliders. Calculate and display probabilities for specific intervals using probability tools, and shade the corresponding areas.
The prompt above was compiled from the original drawing commands and is for reference only.