
Normal Distribution Graphic
Loading the math board and drawing, please wait…
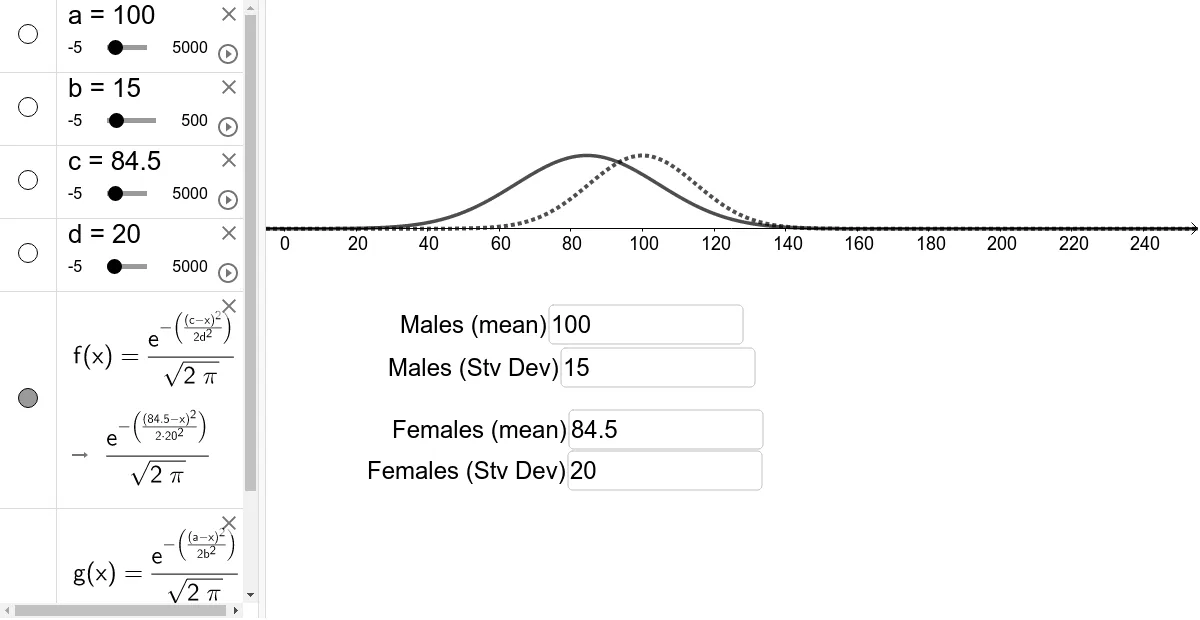
This example demonstrates the graphic representation and properties of the normal distribution. It involves core mathematical concepts such as normal distribution, special points, continuity, and probability & statistics. The construction utilizes GeoGebra commands/objects like Textfield, a, InputBox1, b, InputBox2, c, d, InputBox3, InputBox4, f, g. Suitable for high school students and mathematicians/researchers.
GeoGebra Commands & Parameters
Textfield(a) → InputBox1Textfield(b) → InputBox2Textfield(c) → InputBox3Textfield(d) → InputBox4