
Normal Distribution Demo
Loading the math board and drawing, please wait…
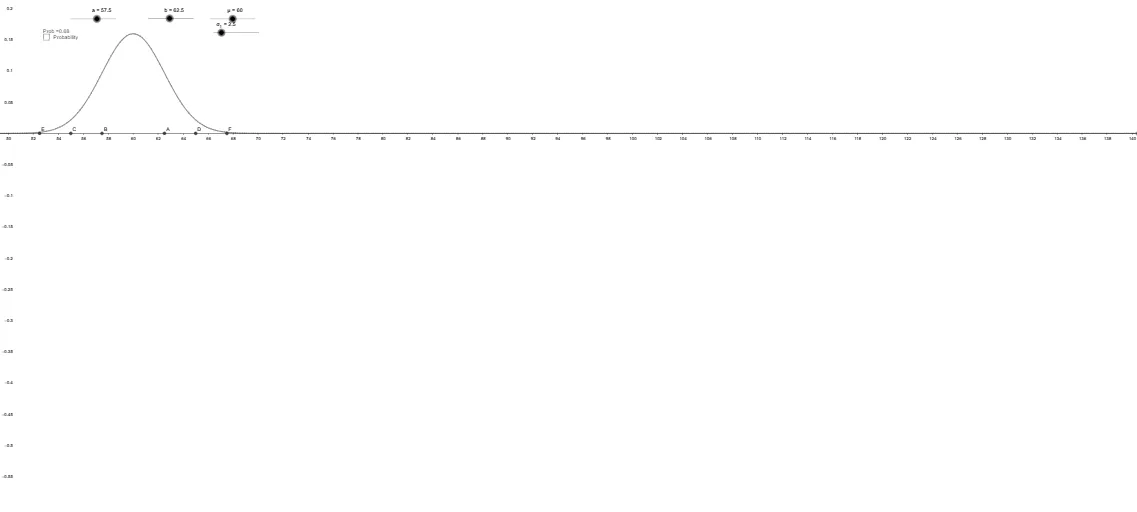
This example demonstrates the graphical representation of the normal distribution curve and its related properties. Core math concepts include normal distribution, integral calculus, and matrix operations. It is constructed using GeoGebra commands like Segment, Normal, Point, and Integral to draw the normal distribution curve, normal lines, integral areas, and points. Suitable for introductory university mathematics or statistics courses.
GeoGebra Commands & Parameters
Segment(G, A) → a_1Normal(μ, σ_1, -0.5) → P1Point(xAxis) → HIntegral(f, a, b) → Prob