
Normal Distribution Demo by John Stenger
Loading the math board and drawing, please wait…
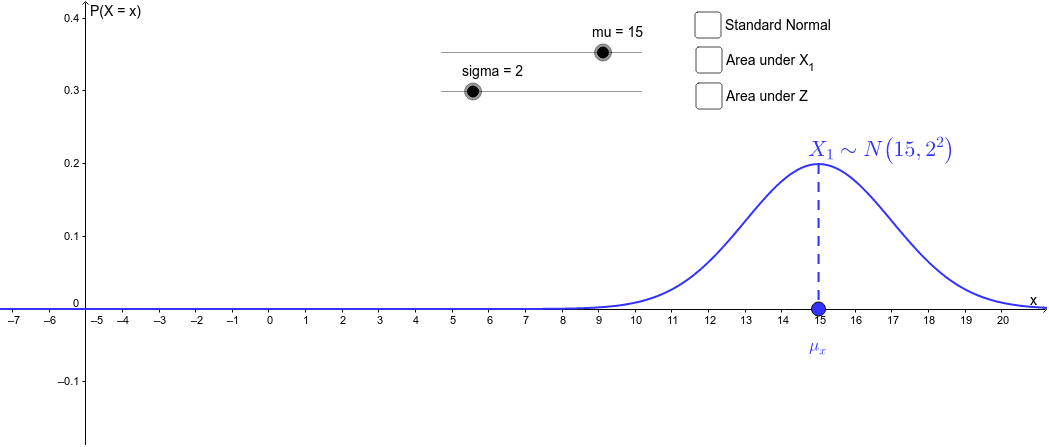
This example demonstrates the normal distribution curve and its related properties. Key math concepts include normal distribution, straight lines, step functions, linear programming, constructions, and Pythagorean theorem. Construction highlights involve using Normal, Segment, Point, and IntegralBetween commands to create the curve, segments, points, and calculate integral areas. Suitable for high school students and math enthusiasts learning probability & statistics and calculus.
GeoGebra Commands & Parameters
Normal(mu, sigma, x) → X_{1}Normal(0, 1, x) → ZSegment(A, B) → mean_{z}Segment(C, D) → mean_{x}Point(xAxis) → ENormal(0, 1, x(F)) → area_{z}Normal(mu, sigma, x_{upper}) → area_{x}IntegralBetween(X_{1}, 0, -1000000, x_{upper}) → shading_{x}IntegralBetween(Z, 0, -1000000, x(F)) → shading_{z}
AI Drawing Prompt Reference
Draw a normal distribution curve with mean 0 and standard deviation 1. Use a line to represent the mean and a point to mark a specific position on the x-axis. Calculate and fill the area to the left of the x-axis and up to a specific point to visually demonstrate probability density.
The prompt above was compiled from the original drawing commands and is for reference only.