
Normal Distribution Demo by Gareth Dudding
Loading the math board and drawing, please wait…
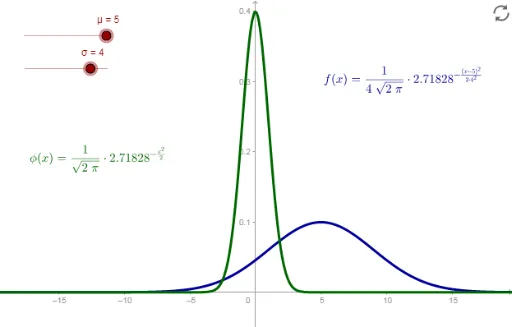
This example demonstrates how the normal distribution curve changes with parameters; involves core math concepts like normal distribution, mean μ, standard deviation σ, probability density function f(x), standard normal distribution function ϕ(x); constructed using GeoGebra commands: sliders σ, μ, e, f, ϕ, texts text1, text2; suitable for high school students and math enthusiasts learning probability & statistics.
GeoGebra Commands & Parameters
Numeric σ(4)Numeric μ(5)Numeric e(2.718281828459045)f(x) = (1 / ((σ * sqrt((2 * π)))) * e^(((-(x - μ)^(2))) / ((2 * σ^(2)))))ϕ(x) = (1 / sqrt((2 * π)) * e^(((-x^(2))) / 2))
AI Drawing Prompt Reference
Draw a graph showing how the normal distribution curve changes with parameters, including two sliders for standard deviation and mean, and two function curves for general and standard normal distributions, with relevant mathematical symbols and text annotations.
The prompt above was compiled from the original drawing commands and is for reference only.