
Normal Distribution Curve
Loading the math board and drawing, please wait…
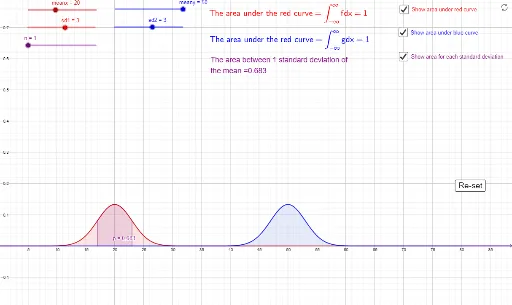
This example demonstrates the normal distribution curve, illustrating important concepts in probability and statistics. Using commands like Normal and Integral, you can observe how the curve's shape and parameters affect the distribution. Suitable for high school and above students learning probability and calculus.
GeoGebra Commands & Parameters
Normal(meanx, sd1, x, false) → fNormal(meany, sd2, x, false) → gIntegral(f, meanx - (10 * sd1), meanx + (10 * sd1), true) → i_{1}Integral(g, meany - (10 * sd2), meany + (10 * sd2), true) → i_{2}Integral(f, meanx - (n * sd1), meanx + (n * sd1), true) → p
AI Drawing Prompt Reference
Draw a normal distribution curve, showing how the mean and standard deviation affect the distribution, and calculate the integral of the curve within ±10 standard deviations from the mean, as well as within ±n standard deviations, to observe the symmetry and probability distribution characteristics.
The prompt above was compiled from the original drawing commands and is for reference only.