
Normal Distribution Curve by tmoorehead
Loading the math board and drawing, please wait…
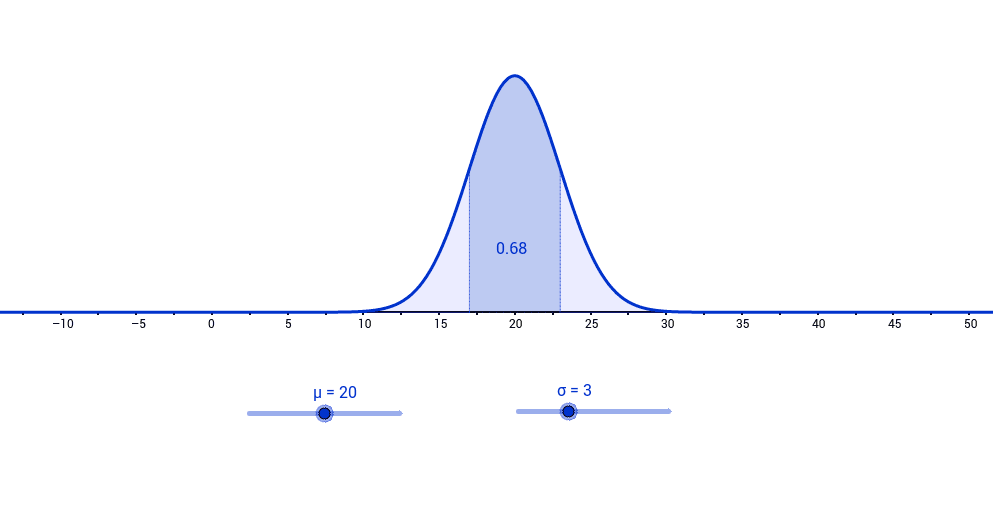
This example demonstrates the construction and dynamic behavior of a normal distribution curve. It involves core mathematical concepts such as normal distribution, integral calculus, derivatives, and parametric equations. Key GeoGebra commands used include Normal, Segment, and Integral to plot the curve, define segments, and compute integral areas. Suitable for high school students and mathematics enthusiasts studying probability statistics and calculus.
GeoGebra Commands & Parameters
Normal(μ, σ, x) → gSegment((μ, 0), (μ, g(μ))) → cSegment((μ + σ, 0), (μ + σ, g(μ + σ))) → bSegment((μ - σ, 0), (μ - σ, g(μ - σ))) → aIntegral(g, μ - σ, μ + σ) → dIntegral(g, μ - (4 * σ), μ - σ) → eIntegral(g, μ + σ, μ + (4 * σ)) → f
AI Drawing Prompt Reference
Draw a normal distribution curve and highlight the areas within one and four standard deviations from the mean. Connect the mean point to the curve points at one and four standard deviations with line segments. Also, connect the mean point to the curve points at two standard deviations from the mean on both sides with line segments. Finally, calculate and display the area under the curve within one standard deviation and within two standard deviations on both sides of the mean.
The prompt above was compiled from the original drawing commands and is for reference only.