
Normal Distribution - Change Mean and Standard Deviation
Loading the math board and drawing, please wait…
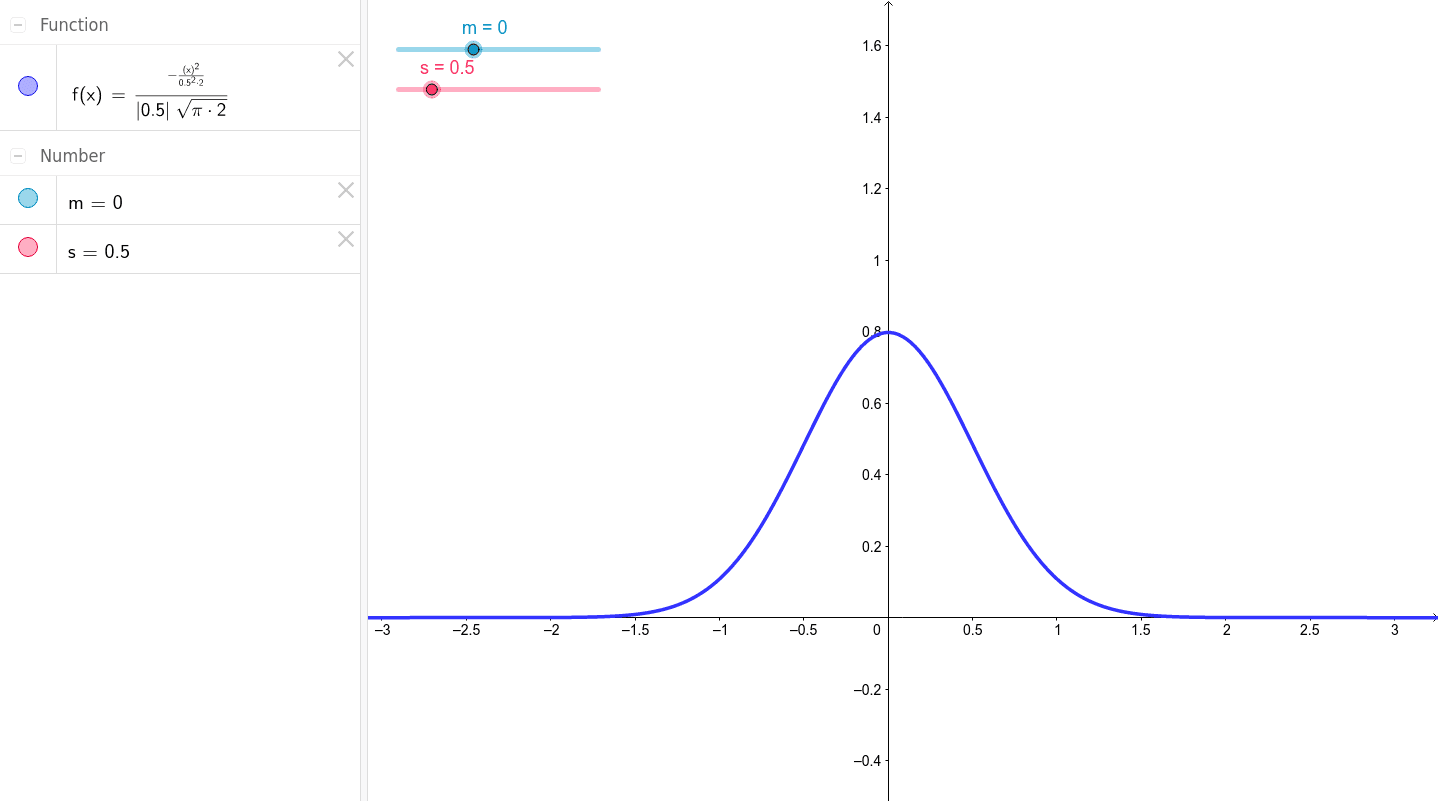
This example demonstrates the dynamic graph of a normal distribution as its mean and standard deviation change. Key math concepts include normal distribution, mean, standard deviation, symmetry, and statistical characteristics. It is constructed using the GeoGebra command Normal for the function f, with sliders m and s to control the mean and standard deviation respectively. Suitable for high school students and learners needing a visual understanding of normal distribution properties.
GeoGebra Commands & Parameters
Normal(m, s, x) → f
AI Drawing Prompt Reference
Draw a normal distribution curve that can be adjusted by sliders for mean and standard deviation. Start by setting the mean slider m to 0 and the standard deviation slider s to 1. Then use the formula f(x) = Normal(m, s, x) to plot the curve. Observe how the curve changes as you move the sliders, and understand the impact of mean and standard deviation on the normal distribution.
The prompt above was compiled from the original drawing commands and is for reference only.