
Normal Distribution Applet
Loading the math board and drawing, please wait…
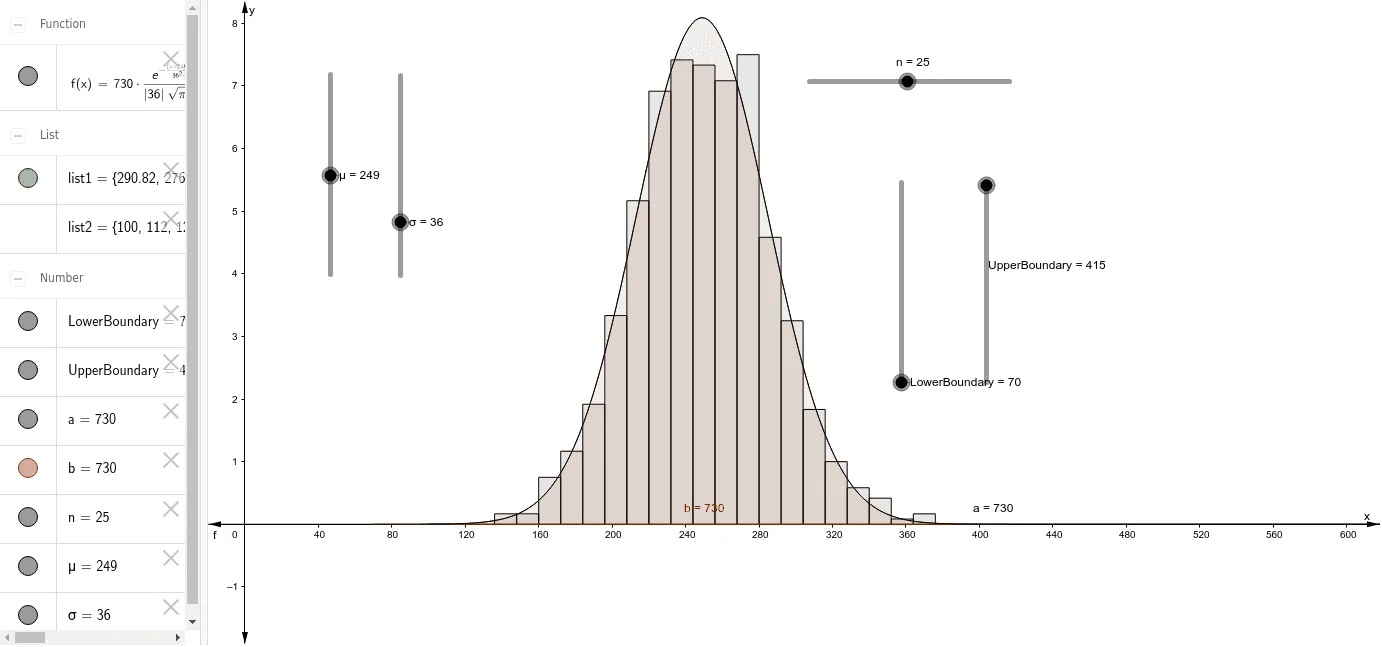
① This applet demonstrates the normal distribution through an interactive visualization, including the probability density curve, histogram, and key statistical measures such as mean and standard deviation. ② Core mathematical concepts include normal distribution, mean, standard deviation, probability density function, cumulative probability via integration, histogram, and statistical characteristics like mode and median. ③ Construction uses GeoGebra commands: Histogram to create data bins, Integral to compute area under the curve for probabilities, Mean and SD for statistical parameters; numerous objects (A1 to A40) store data points, statistics, and graphical elements, with sliders or inputs for real-time parameter adjustment. ④ Suitable for high school and university courses in statistics and probability, as a teaching tool or for self-study to explore how changing parameters affects the distribution shape.
GeoGebra Commands & Parameters
Histogram(list2, list1, true, 1) → aIntegral(f, LowerBoundary, UpperBoundary) → bMean(list1) → D6SD(list1) → D7
AI Drawing Prompt Reference
Draw a normal distribution probability density curve and histogram, showing mean and standard deviation. First create a histogram for the data, then calculate the area under the curve for probabilities, and finally mark the mean and standard deviation.
The prompt above was compiled from the original drawing commands and is for reference only.