
Normal Distribution Animation: Effects of Mean and Standard Deviation
Loading the math board and drawing, please wait…
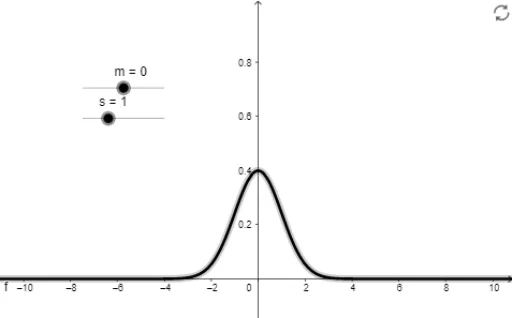
① This GeoGebra example dynamically animates the normal distribution curve, showing how the bell-shaped curve shifts and changes width as the mean m and standard deviation s are adjusted. ② The core mathematical concept is the normal (Gaussian) distribution in probability and statistics, including the probability density function, mean, standard deviation, symmetry, and the intuitive idea of area under the curve representing probability. ③ Construction highlights: The Normal command in GeoGebra is used to generate the probability density function, with sliders m (mean) and s (standard deviation) as adjustable parameters; the function object f updates in real time, creating the animation. ④ This is suitable for high school through undergraduate statistics courses, including AP Statistics or introductory college statistics, helping students build an intuitive understanding of how parameters shape the distribution and supporting later topics like standardization and z-scores.
GeoGebra Commands & Parameters
Normal(m, s, x, false) → f
AI Drawing Prompt Reference
Draw a normal distribution curve whose shape is controlled by two adjustable parameters: the mean determines the horizontal position, and the standard deviation determines the width. The curve is bell-shaped, symmetric about the mean, with its peak at the mean, and the area under the curve represents probability. Include two sliders, one for the mean and one for the standard deviation, so that when the sliders move, the curve updates in real time, showing how the curve shifts with the mean and widens or narrows with the standard deviation.
The prompt above was compiled from the original drawing commands and is for reference only.