
Normal Approximation
Loading the math board and drawing, please wait…
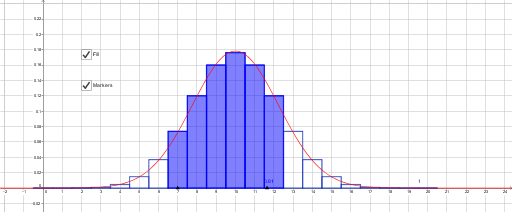
This example demonstrates how a binomial distribution approximates a normal distribution as parameters change. Key mathematical concepts include binomial distribution, normal distribution, and probability. Using GeoGebra commands Sequence, Min, Max, Point, and BarChart, the probability distribution changes are visually illustrated. Suitable for high school mathematics education and learning probability statistics.
GeoGebra Commands & Parameters
Sequence(20, 20, 0, 20) →Min(x(Point[xAxis]) + 1.5, x(Point[xAxis]) + 1.5) →Max(x(Point[xAxis]) + 1.5, x(Point[xAxis]) + 1.5) →Point(xAxis) → APoint(xAxis) → BBarChart({0, 1, 2, 3, 4, 5, 6, 7, 8, 9, 10, 11, 12, 13, 14, 15, 16, 17, 18, 19, 20}, {9.53674316406251E-7, 1.9073486328125E-5, 1.81198120117188E-4, 0.00108718872070313, 0.00462055206298828, 0.0147857666015625, 0.0369644165039064, 0.0739288330078125, 0.120134353637695, 0.160179138183594, 0.176197052001953, 0.160179138183594, 0.120134353637695, 0.0739288330078125, 0.0369644165039064, 0.0147857666015625, 0.00462055206298828, 0.00108718872070313, 1.81198120117188E-4, 1.9073486328125E-5, 9.53674316406251E-7}, 1) → aTake({9.53674316406251E-7, 1.9073486328125E-5, 1.81198120117188E-4, 0.00108718872070313, 0.00462055206298828, 0.0147857666015625, 0.0369644165039064, 0.0739288330078125, 0.120134353637695, 0.160179138183594, 0.176197052001953, 0.160179138183594, 0.120134353637695, 0.0739288330078125, 0.0369644165039064, 0.0147857666015625, 0.00462055206298828, 0.00108718872070313, 1.81198120117188E-4, 1.9073486328125E-5, 9.53674316406251E-7}, x(A) + 1.5, x(B) + 1.5) → list1Take({0, 1, 2, 3, 4, 5, 6, 7, 8, 9, 10, 11, 12, 13, 14, 15, 16, 17, 18, 19, 20}, x(A) + 1.5, x(B) + 1.5) → list2BarChart(list2, list1, 1) → b
AI Drawing Prompt Reference
Draw a bar chart for a binomial distribution with the x-axis ranging from 0 to 20, and the y-axis showing probability values. As parameters change, the bar chart approximates a normal distribution. First, draw the x-axis, then plot the bar chart based on the given probability values.
The prompt above was compiled from the original drawing commands and is for reference only.