
Normal and t Distributions
Loading the math board and drawing, please wait…
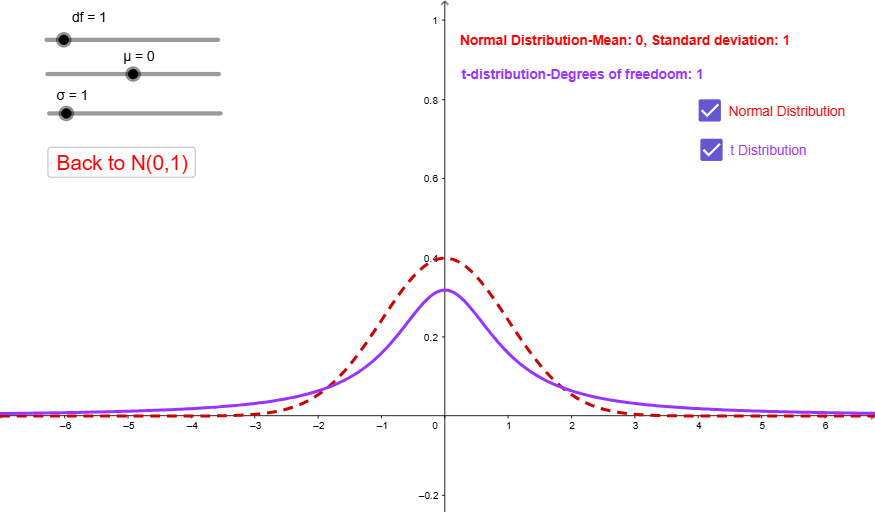
This example demonstrates the graphical representation and differences between normal and t distributions. Key math concepts include probability & statistics, normal distribution curves, t distribution curves, standard deviation, mean, degrees of freedom, etc. Construction highlights using GeoGebra commands: Normal, TDistribution, σ (standard deviation), μ (mean), df (degrees of freedom), f (function), g (function), text2 (text), Z (normal distribution variable), a (parameter), b (parameter), text1 (text), m (mean), s (standard deviation). Suitable for high school and above students to learn and understand core distribution concepts in probability statistics, or for teaching demonstrations.
GeoGebra Commands & Parameters
Normal(μ, σ, x, false) → fTDistribution(df, x, false) → g
AI Drawing Prompt Reference
Draw graphs of normal and t distributions to show their differences, including mean and standard deviation markers, and label the degrees of freedom parameter, first plot the normal distribution curve, then plot the t distribution curve, both displayed in the same coordinate system for comparison.
The prompt above was compiled from the original drawing commands and is for reference only.