
Linear Regression: MLB National League Wins 2016 vs 2015
Loading the math board and drawing, please wait…
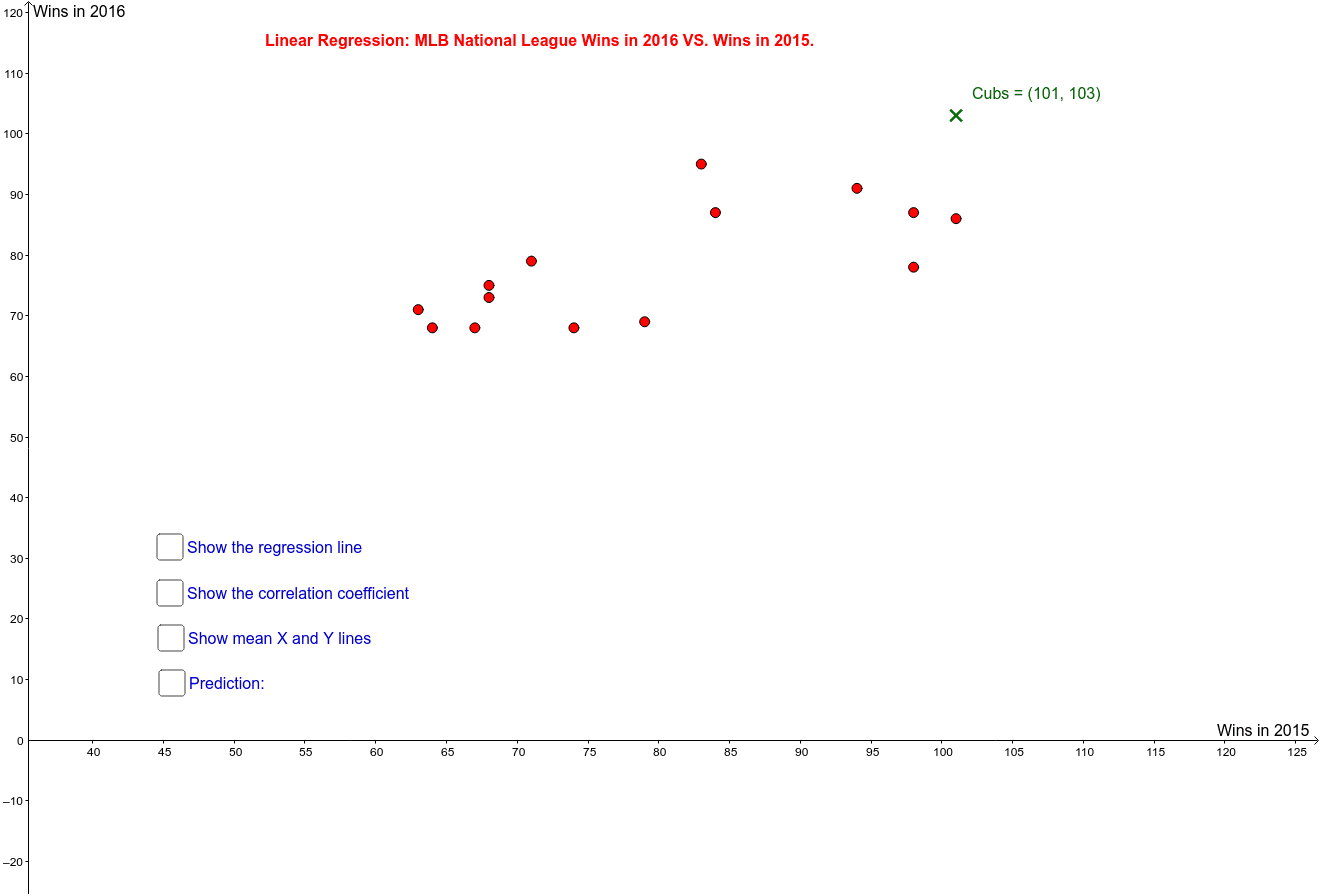
This example demonstrates linear regression analysis on the relationship between 2016 and 2015 MLB National League wins. Key math concepts include linear regression, Pearson's correlation coefficient (PMCC), fitted line, and arithmetic mean. GeoGebra commands used are Textfield, PMCC, FitLineY with objects like C6, B6, C16, B16, E, B2-B15, C2, A, C3-C11, D, Cubs, F-L. Suitable for high school mathematics education, focusing on data analysis and statistical applications.
GeoGebra Commands & Parameters
Textfield(x0) → inputBox2PMCC(list1) → rFitLineY({A, B, C, D, Cubs, E, F, G, H, I, J, K, L, M, N}) → a
AI Drawing Prompt Reference
Plot the relationship between 2015 and 2016 MLB National League wins, including a fitted line, correlation coefficient, and data points for each team. Start by inputting the data points, then calculate the correlation coefficient, and finally fit a line through these points.
The prompt above was compiled from the original drawing commands and is for reference only.