
Normal and t-Distribution
Loading the math board and drawing, please wait…
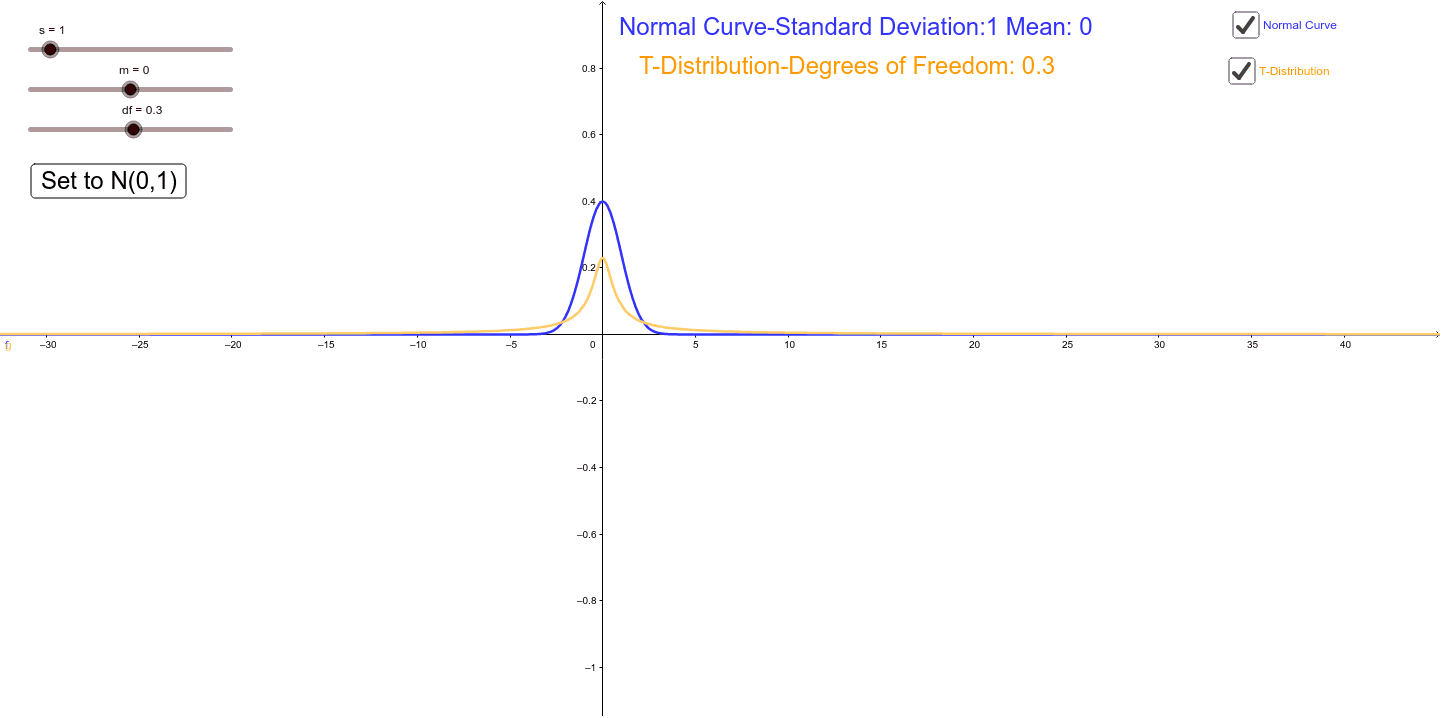
This example demonstrates the graphs of normal and t-distributions. Key mathematical concepts include types of distributions in probability and statistics. Using GeoGebra commands like Normal, TDistribution, etc., parameters such as m, s can be dynamically adjusted to observe changes in the distributions. Suitable for high school and above students to learn about distribution characteristics.
GeoGebra Commands & Parameters
Normal(m, s, x) → fTDistribution(df, x) → gBinomialDist(10, p) → h
AI Drawing Prompt Reference
Plot the graphs of a normal distribution and a t-distribution, with the normal distribution parameterized by mean m and standard deviation s, and the t-distribution by degrees of freedom df, also include a binomial distribution for reference, all on the same coordinate system to compare their shapes and characteristics.
The prompt above was compiled from the original drawing commands and is for reference only.