
Normal and Lognormal Distributions: Mode, Median, and Mean
Loading the math board and drawing, please wait…
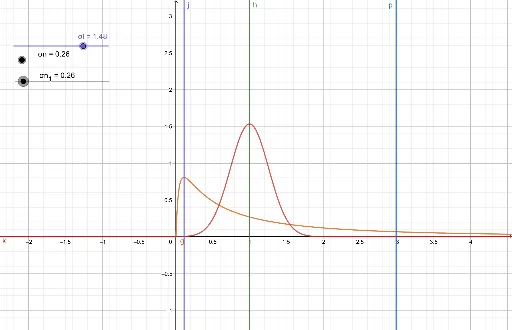
① This example dynamically illustrates the density curves of the normal and lognormal distributions, highlighting the positions of the mode, median, and mean on each curve to reveal how these central tendency measures differ between symmetric and skewed distributions. ② Core mathematical concepts include probability density functions, distribution parameters (mean μ, standard deviation σ), skewness, and the relationships among mode, median, and mean in symmetric versus skewed data. ③ Construction details: Based on the construction summary, sliders (e.g., μl, σl, μn, σn) control distribution parameters, function graphs plot the density curves, and point objects (i, g, k, h, j, p) mark the mode, median, and mean. Additional elements like surfaces or parabolas may support visualization, but the core relies on function graphing and slider interactivity. ④ Suitable for high school to undergraduate statistics courses, as well as introductory data analysis, helping learners intuitively compare characteristic values and understand how skewness affects measures of central tendency.
GeoGebra Commands & Parameters
μl(x) = 0Numeric σl(1.48)x = ℯμn(x) = 1g(x) = 1 / ((((x * σl) * sqrt((2 * π))) * ℯ^(log(x - μl(x))^(2) / ((2 * σl^(2))))))Numeric σn(0.26)k(x) = 1 / (((σn * sqrt((2 * π))) * ℯ^((x - μn(x))^(2) / ((2 * σn^(2))))))h: x = ℯ^(μl(x))j: x = ℯ^(μl(x) - σl^(2))p: x = ℯ^((μl(x) + σl^(2)) / 2)Numeric σn_1(0.26)
AI Drawing Prompt Reference
Draw two probability density curves: a normal distribution with mean 1 and standard deviation 0.26, and a lognormal distribution with log-mean adjustable via slider and log-standard deviation fixed at 1.48. On each curve, mark the mode, median, and mean as distinct points. The normal curve is symmetric with all three points coinciding; the lognormal curve is right-skewed with mode leftmost, median middle, and mean rightmost. Also draw three vertical reference lines at the exponential of the log-mean, mode, and median of the lognormal distribution to compare positions.
The prompt above was compiled from the original drawing commands and is for reference only.