
Non-rigid Transformations of Quadratic Functions: Exploring Vertex Form Graphs w
Loading the math board and drawing, please wait…
In collections
Function transformation, translations, and reflections
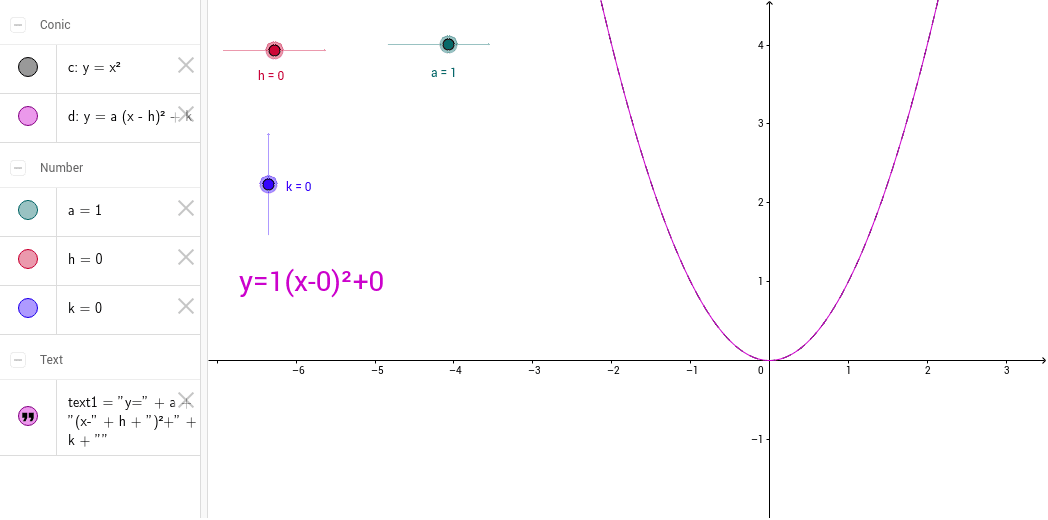
This GeoGebra example demonstrates how the graph of a quadratic equation in vertex form, y = a(x-h)² + k, transforms when the values of a, h, and k are changed using interactive sliders. Students can visually discover non-rigid transformations of the parabola, including vertical stretching and compressing, reflection across the x-axis, and horizontal and vertical translations. The core mathematical concepts involved are quadratic functions, parabolas, vertex form, function transformations, and coordinate geometry. The construction relies on GeoGebra objects c, h, k, a, text1, and d, where sliders drive dynamic updates to the function graph and accompanying text annotations. This resource is suitable for middle school and high school mathematics instruction, inquiry-based learning, and classroom demonstrations of graphing and transformation principles.
GeoGebra Commands & Parameters
Conic cNumeric h(0.0)Numeric k(0.0)Numeric a(1.0)y = a * (x - h)^(2) + k
AI Drawing Prompt Reference
Draw a quadratic function graph in vertex form, y = a(x-h)² + k, where a, h, and k can be adjusted using sliders. First, draw a conic section c, then set sliders h, k, and a to 0, 0, and 1 respectively. Finally, use the sliders to adjust a, h, and k to observe the non-rigid transformations of the parabola, including vertical stretching and compressing, reflection across the x-axis, and horizontal and vertical translations.
The prompt above was compiled from the original drawing commands and is for reference only.