
Napier's Bones Demonstration
Loading the math board and drawing, please wait…
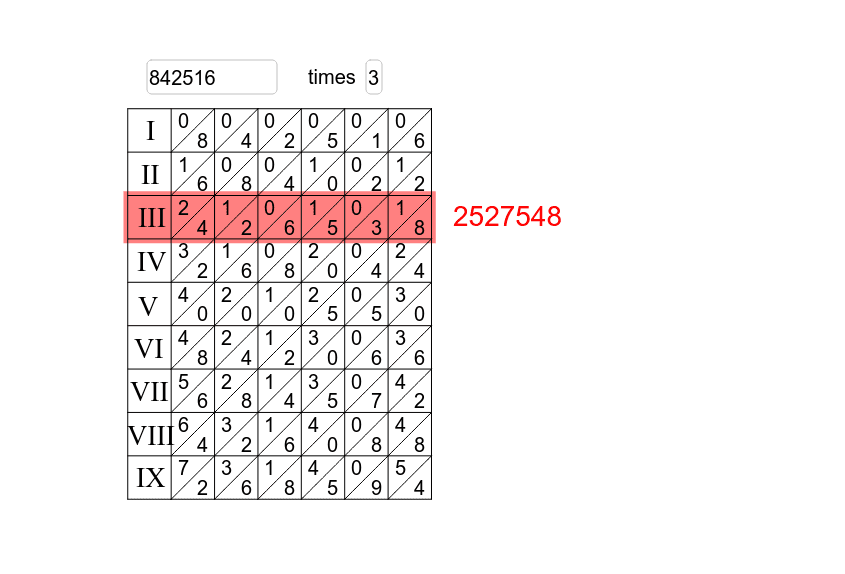
This example illustrates the calculation principle and structure of Napier's bones, involving core math concepts like multiplication, digit decomposition, and geometric arrangement. It is constructed using commands such as Textfield, Sequence, Polygon, and Text, making it suitable for middle school students and above to learn multiplication algorithms and geometric representations.
GeoGebra Commands & Parameters
Textfield(num1) → inputBox1Sequence(floor(Mod[num1, 10^(k + 1)] / 10^(k)), k, a - 1, 0, -1) → list1Sequence(If[Max[1, k - 9] ≤ x ≤ Min[a + 1, k], x - k], k, 1, 9 + a) → list2Sequence(Sequence[Text[Mod[Element[list1, r] * k, 10], (r + 0.6, 1 - k - 0.9)], k, 1, 9], r, 1, a) → list6Sequence(Sequence[Text[floor(Element[list1, r] * k / 10), (r + 0.15, 1 - k - 0.45)], k, 1, 9], r, 1, a) → list5Textfield(num2) → inputBox2Sequence(Segment[(0, k), (a + 1, k)], k, -9, 0) → list4Sequence(Segment[(k, 0), (k, -9)], k, 0, a + 1) → list3Polygon((-0.1, -num2 + 1.1), (a + 1.1, -num2 + 1.1), (a + 1.1, -num2 - 0.1), (-0.1, -num2 - 0.1)) → poly1, b, c, d, eText(num1 * num2, (a + 1.5, -num2 + 0.3)) → text10
AI Drawing Prompt Reference
Draw a diagram illustrating the calculation principle and structure of Napier's bones, featuring an input box for numbers, multiple text labels showing digit decomposition in multiplication, and geometric shapes representing the multiplication process. Start by drawing horizontal and vertical lines to form a grid, then fill the grid with number texts, and finally display the multiplication result below the diagram.
The prompt above was compiled from the original drawing commands and is for reference only.