
Modulus Function Graph (Linear)
Loading the math board and drawing, please wait…
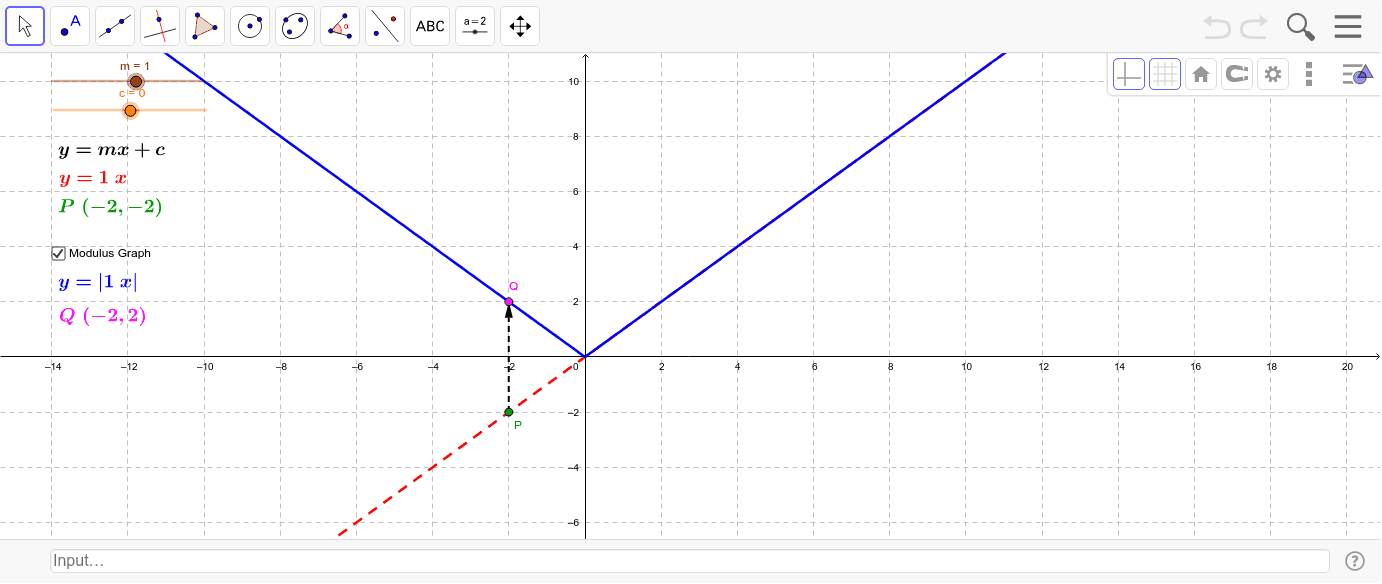
This example demonstrates the graph of a linear modulus function, showcasing its basic properties such as symmetry and piecewise linearity. Using GeoGebra commands like Point, Vector, and Equation, you can dynamically adjust the function parameters to observe changes in the graph. Suitable for high school mathematics education and learning.
GeoGebra Commands & Parameters
Point(f) → PVector(P, Q) → u
AI Drawing Prompt Reference
Draw the graph of a linear absolute value function, which forms a V-shape and is symmetric about its axis. Place a point on the curve, then draw a vector from that point to another point also on the curve, illustrating the direction and distance between the two points. The graph should clearly show the coordinate axes, the function curve, and these two key points, making it easy to observe the vertex, symmetry, and piecewise linear nature of the absolute value function.
The prompt above was compiled from the original drawing commands and is for reference only.