
Minkowski Diagram I: Time Axis and Light Cone
Loading the math board and drawing, please wait…
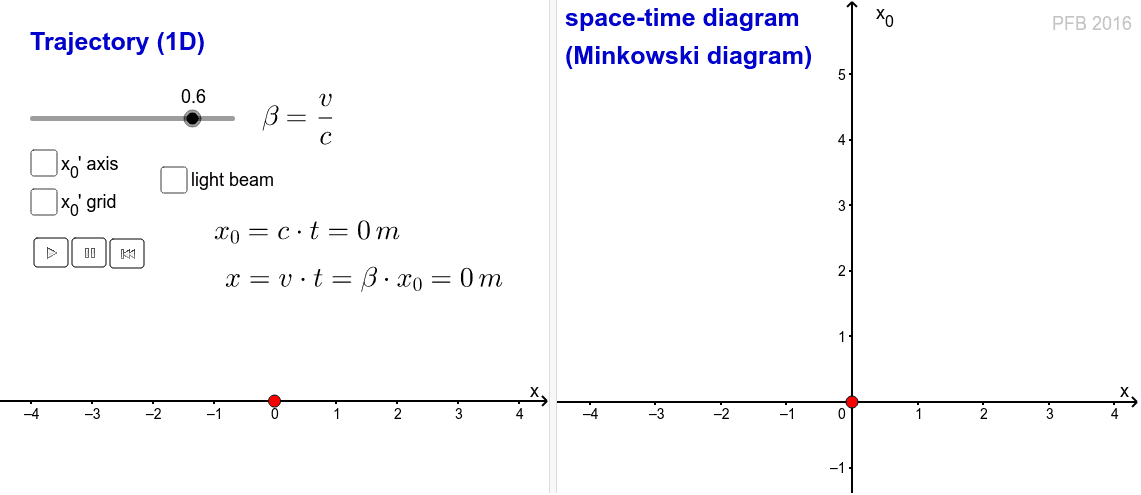
①This example demonstrates the construction of a Minkowski spacetime diagram in special relativity, focusing on the time axis and the light cone. ②Core mathematical concepts include spacetime coordinates, the light cone (events with zero interval), timelike vs spacelike regions, and geometric visualization of Lorentz transformations. ③Construction uses GeoGebra commands such as Polygon, If, and Segment, with interactive sliders (button1-4) to adjust parameters, involving objects like points P, P0-P7, lines d, e, f, g, and text labels text1-4, using conditional logic (If) for dynamic toggling. ④Suitable for high school or university physics courses introducing relativity, as well as mathematics classes exploring hyperbolic geometry and cone surfaces, providing an intuitive grasp of spacetime structure.
GeoGebra Commands & Parameters
Polygon((-5, -6), (5, -6), (5, 7), (-5, 7)) → poly1, d, e, f, gIf(v ≠ 0, y = x / v + 1 / v, x = -1) → hIf(v ≠ 0, y = x / v + 2 / v, x = -2) → iIf(v ≠ 0, y = x / v + 3 / v, x = -3) → jIf(v ≠ 0, y = x / v + 4 / v, x = -4) → kIf(v ≠ 0, y = x / v + 5 / v, x = -5) → lIf(v ≠ 0, y = x / v + 6 / v, x = -6) → mIf(v ≠ 0, y = x / v + 7 / v, x = -7) → nIf(v ≠ 0, y = x / v + 8 / v, x = -8) → pIf(v ≠ 0, y = x / v + 9 / v, x = -9) → qIf(v ≠ 0, y = x / v + 10 / v, x = -10) → rIf(v ≠ 0, y = x / v + 11 / v, x = -11) → sIf(v ≠ 0, y = x / v - 1 / v, x = 1) → a_1If(v ≠ 0, y = x / v - 2 / v, x = 2) → b_1If(v ≠ 0, y = x / v - 3 / v, x = 3) → c_1If(v ≠ 0, y = x / v - 4 / v, x = 4) → d_1If(v ≠ 0, y = x / v - 5 / v, x = 5) → e_1If(v ≠ 0, y = x / v - 6 / v, x = 6) → f_1If(v ≠ 0, y = x / v - 7 / v, x = 7) → g_1If(v ≠ 0, y = x / v - 8 / v, x = 8) → h_1If(v ≠ 0, y = x / v - 9 / v, x = 9) → i_1If(v ≠ 0, y = x / v - 10 / v, x = 10) → j_1If(v ≠ 0, y = x / v - 11 / v, x = 11) → k_1If(v ≠ 0, y = x / v, x = 0) → bSegment(L1, L2) → l_1Segment(O, L3) → m_1Segment(O, L4) → n_1
AI Drawing Prompt Reference
Draw a Minkowski spacetime diagram featuring a rectangular background with two perpendicular axes representing time and space. Include multiple lines extending from the origin at varying slopes to form a light cone, with some lines going upwards and others downwards. This visualizes the structure of spacetime in special relativity, highlighting the light cone and the regions of timelike and spacelike events.
The prompt above was compiled from the original drawing commands and is for reference only.