
Microeconomics Monopoly Cost Curves
Loading the math board and drawing, please wait…
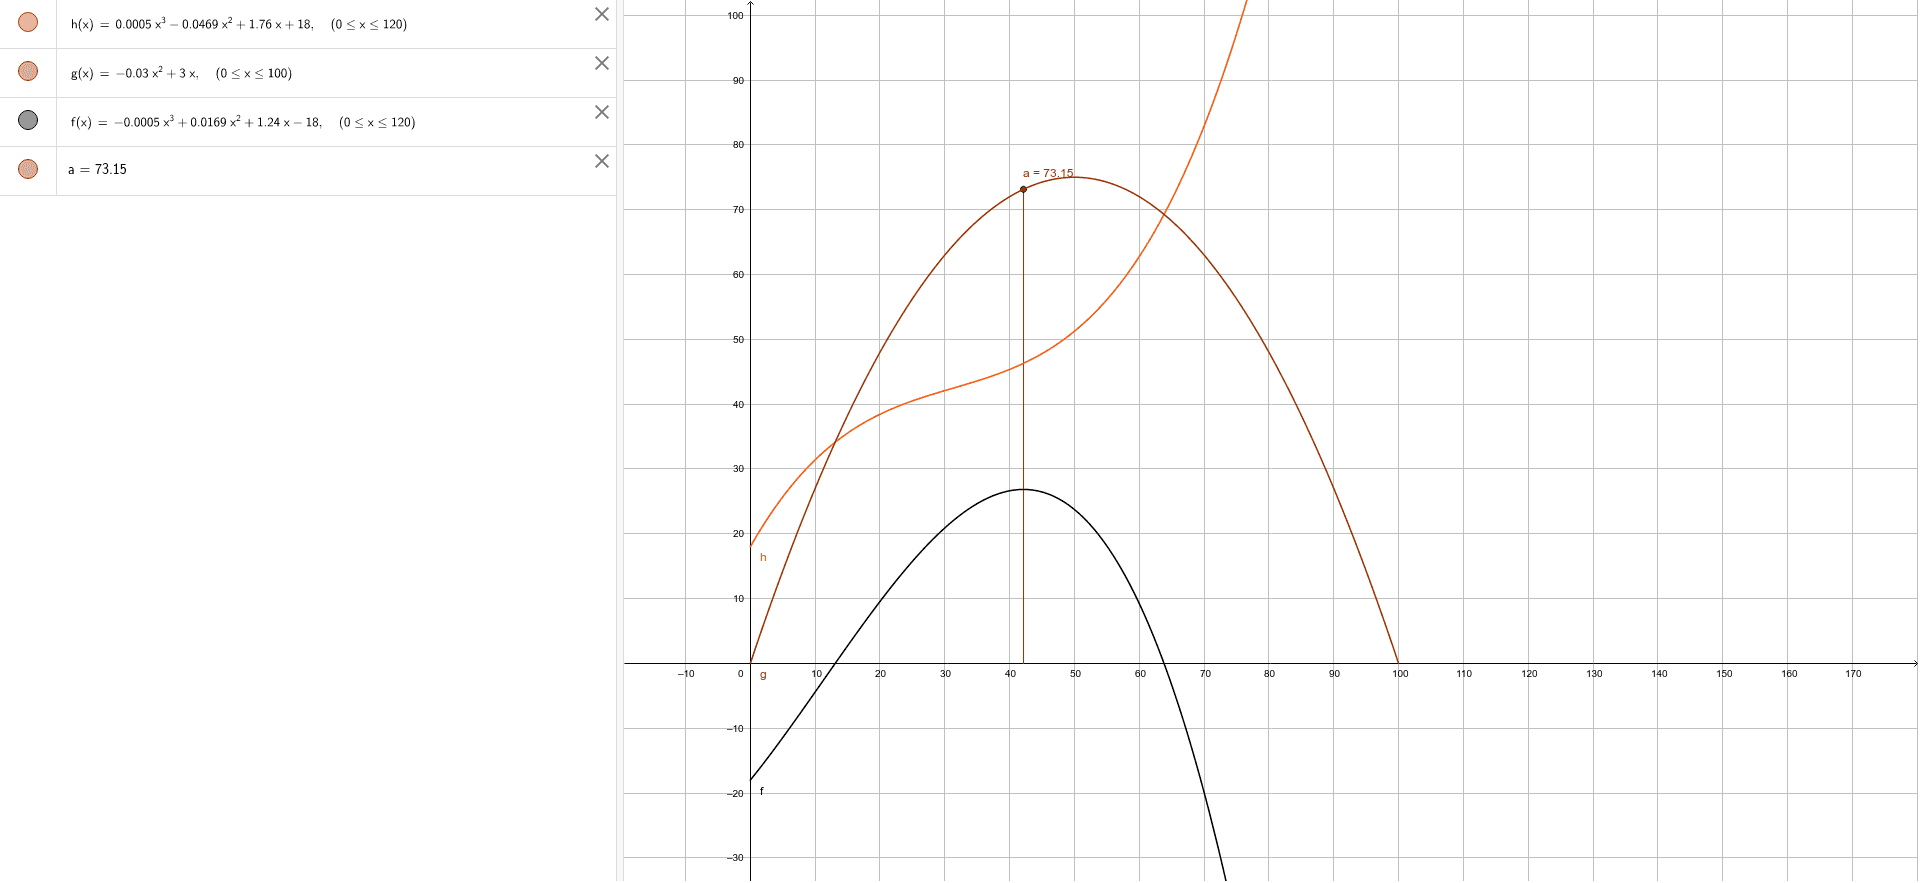
This example demonstrates the graphical representation of cost curves faced by a monopoly in microeconomics. Key math concepts include cost functions, marginal cost, and average cost. The construction uses GeoGebra's StickGraph command to plot objects h, g, f, a, illustrating the geometric forms of cost curves. Suitable for high school and above economics and calculus students to understand monopoly cost structures.
GeoGebra Commands & Parameters
StickGraph({(42.1472, 73.15)}) → a
AI Drawing Prompt Reference
Draw a graph illustrating the cost curves for a monopoly in microeconomics, highlighting cost functions, marginal cost, and average cost. Plot four key curves representing different cost shapes in descending order from top to bottom to clearly show the changes in cost structure.
The prompt above was compiled from the original drawing commands and is for reference only.