
MEI Further Maths Statistics Ex8.1 Q10: Histogram Construction
Loading the math board and drawing, please wait…
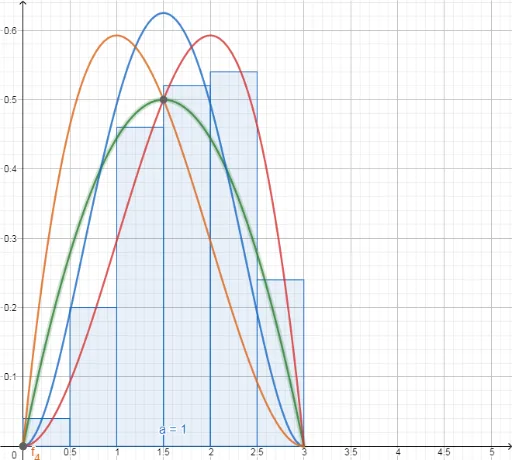
This example demonstrates how to use GeoGebra to construct a histogram for a set of data. Key math concepts include Probability & Statistics, Random Variables, and Linear Equations. The construction uses the GeoGebra Histogram command with objects a, f₁, f₂, f₃, f₄. Suitable for high school students learning probability statistics, helping them understand data distribution and frequency representation.
GeoGebra Commands & Parameters
Histogram({0, 0.5, 1, 1.5, 2, 2.5, 3}, (0.01 * {4, 20, 46, 52, 54, 24})) → a